Quantcast
Channel: InterWorks
Viewing all 2695 articles
Browse latest View live

Advance with Assist: Filtering Select Dates with DATETRUNC

$
0
0

Welcome to the first edition of “Advancing with Assist.” This week’s question came from a newer user to Tableau who asked:

“I only need values before the first day of the current month. Is there an easier way than excluding the month manually each time my data is updated?”

The InterWorks Assist team hopped on a screen-share with the client and saw that using a Date Calculation would be the best route forward for what they needed to do. The client had never used the function DATETRUNC before.

Using the function with the date part of month allows them to quickly find the first date of any given row of data and compare that to the TODAY() function in order to filter her data appropriately. Their calculation and application looked like this:

With InterWorks Assist, you’ll have access to the collective might of a global team of data experts, including:

  • Solution Architects
  • Analytics Consultants
  • Tableau Trainers
  • Data Engineers
  • Server Engineers


For more information visit the InterWorks Assist page.

The post Advance with Assist: Filtering Select Dates with DATETRUNC appeared first on InterWorks.


PYD59 – Tableau Conference Europe 2018, Part 2

$
0
0

Tableau Conference Europe 2018 is next week! Besides making last minute preparations, David Pires finishes up talking to some fantastic people in the data community that you can meet at TC18Europe – Simon Beaumont, Rebecca Roland, Tristan Guillevin, and Tableau’s Sara Fernandes.

We hope to see you in London; stop by our booth and say “hello” to David and the rest of the InterWorks team. We love making new friends.

Subscribe to Podcast Your Data through iTunesStitcherPocket Casts or your favorite podcasting app.

The post PYD59 – Tableau Conference Europe 2018, Part 2 appeared first on InterWorks.

Two Ways to Build Funnel Charts in Tableau

$
0
0
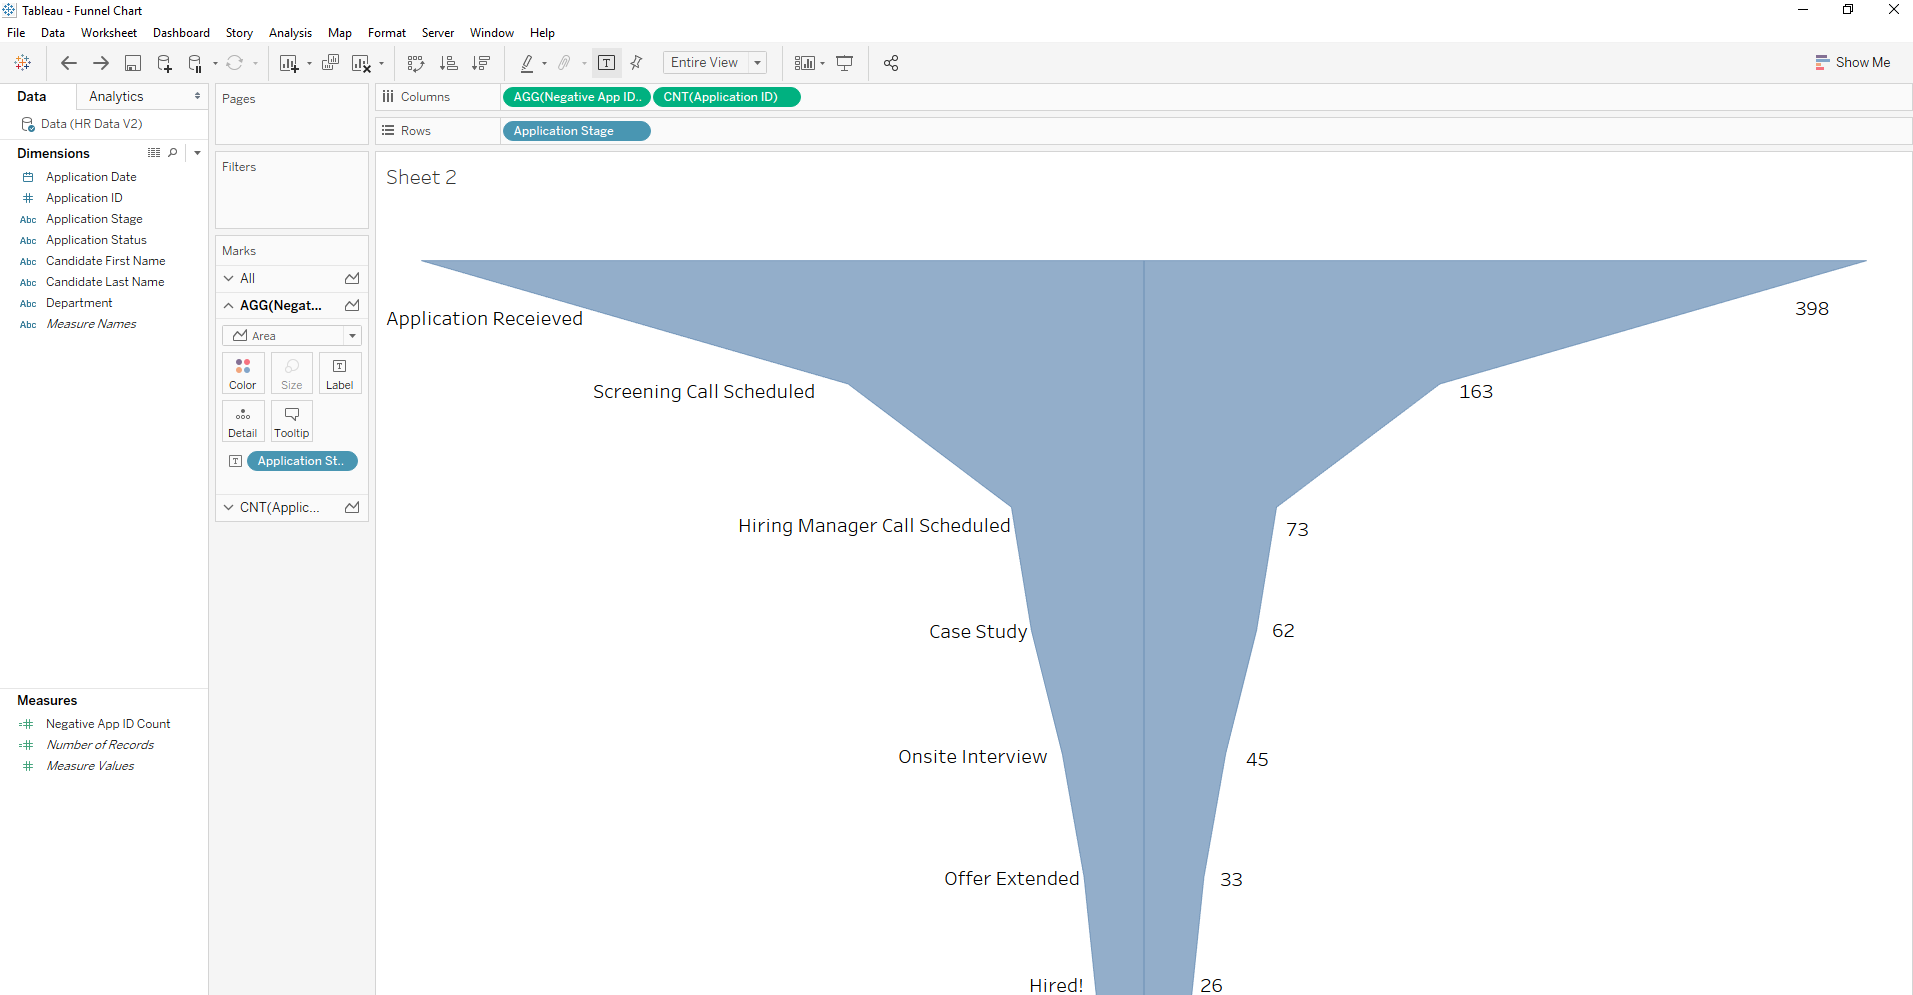
Tableau Funnel Charts: Add Labels and Format

Often in my training classes, I find students who are building dashboards to monitor a linear workflow such as an HR recruiting pipeline or order fulfillment. Tableau is an excellent BI tool to monitor these workflows, and a funnel chart is a powerful, easy-to-build visual that can provide valuable insight into your data.

Funnel charts are a great way to track progress through a workflow with multiple steps. They can highlight how well a process is being followed and easily identify any bottlenecks. You can even use table calculations to look at different ways to measure progress to each step (percent of total, percent change, etc.).

There are two easy to build funnel charts in Tableau: a Stepped Funnel Chart and a Smooth Funnel Chart.

Stepped Funnel Chart

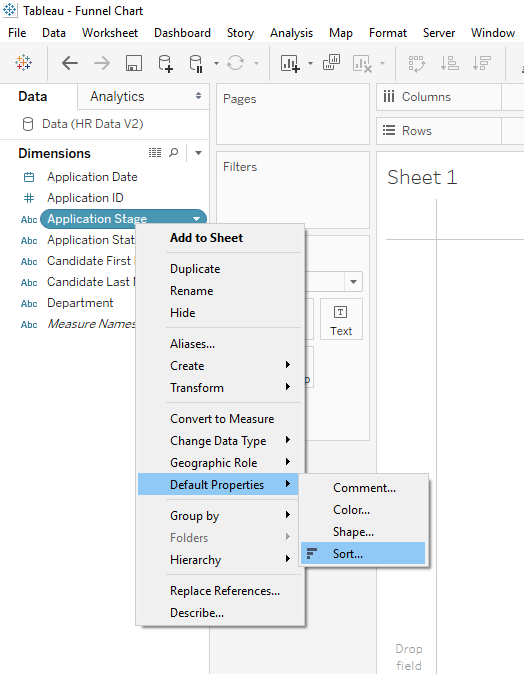
Step 1: Set the default sort order for the stages of your data (Tableau will default to alphabetical).

Tableau Funnel Charts: Set Default Order

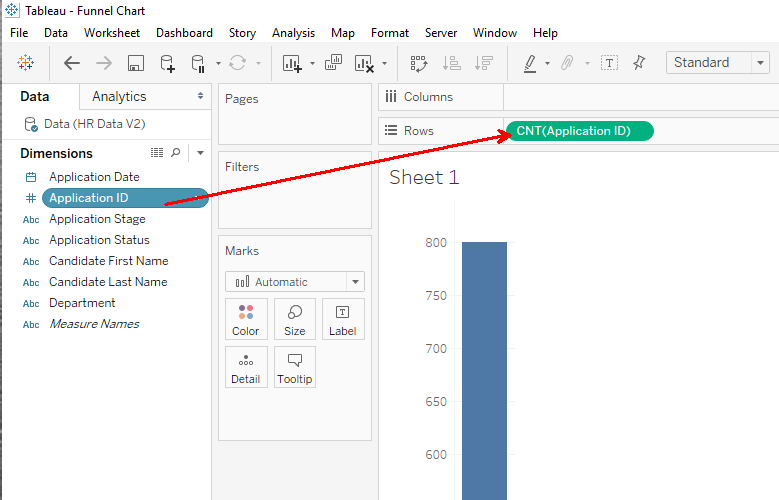
Step 2: Drag your record Count field on to the Rows shelf. This may be the Number of Records field provided by Tableau or an ID dimension field. Ensure the Count or Count Distinct aggregate function is selected.

Tableau Funnel Charts: Count to Rows

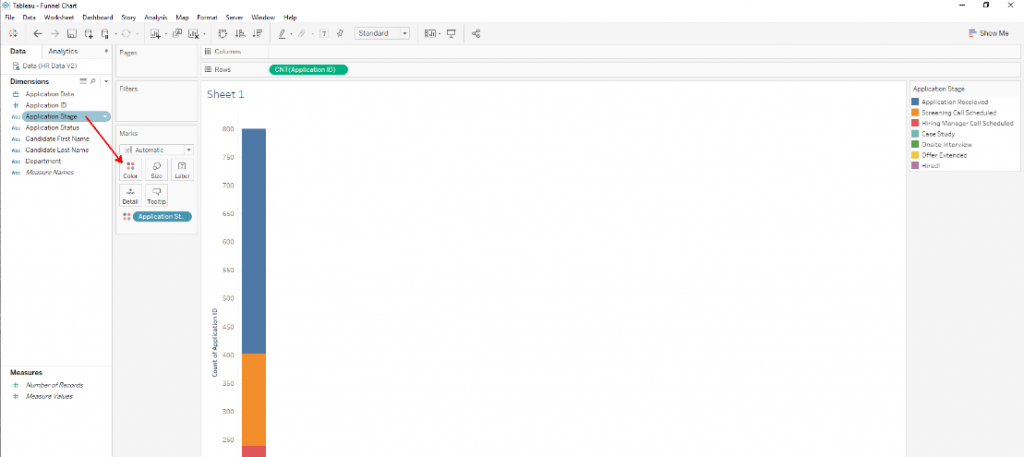
Step 3: Drag the Dimension pill, which includes your stages, onto Color.

Tableau Funnel Charts: Drag Dimension to Color

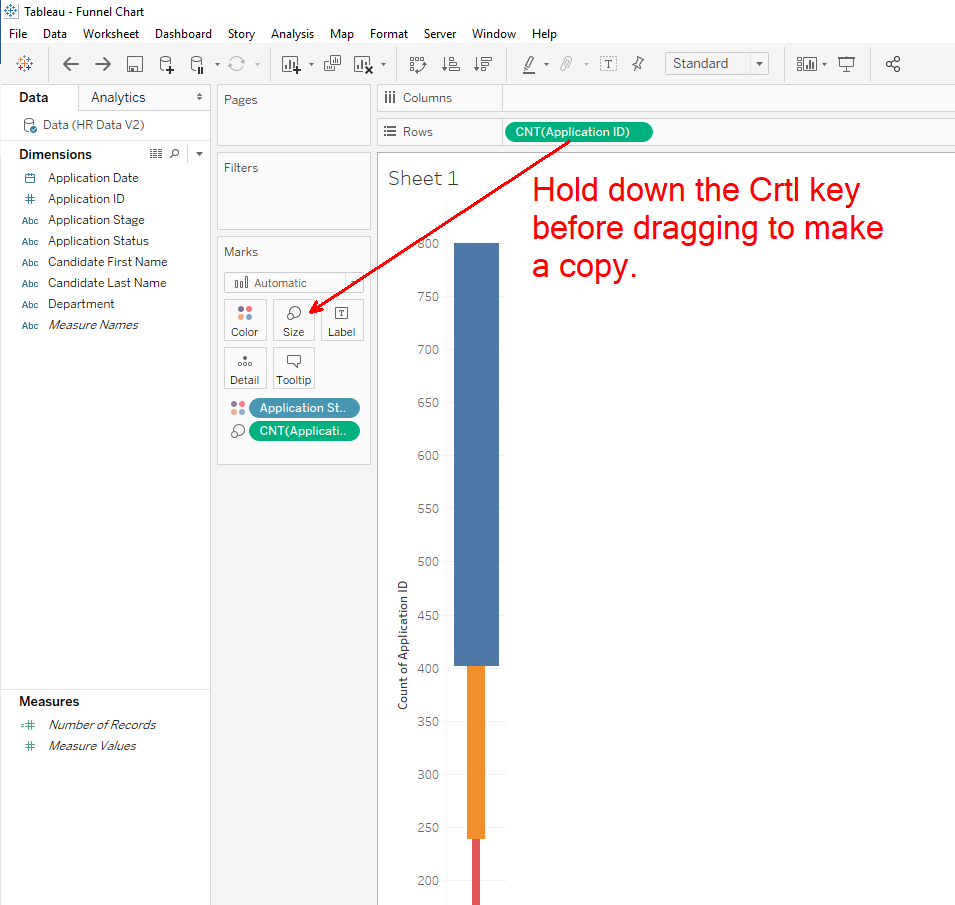
Step 4: Make a copy of your Count field and drag it from the Rows shelf onto the Size tile in the Marks card.

Tableau Funnel Charts: Copy Count to Marks

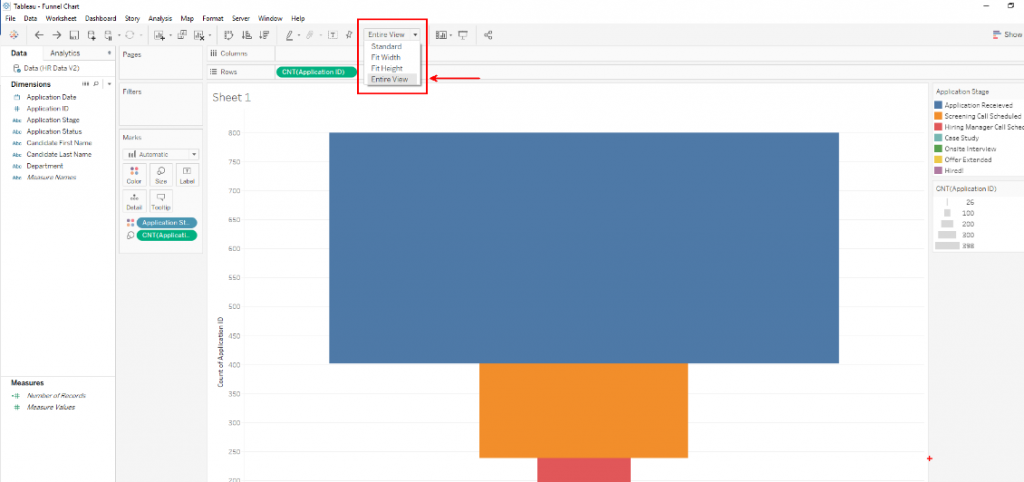
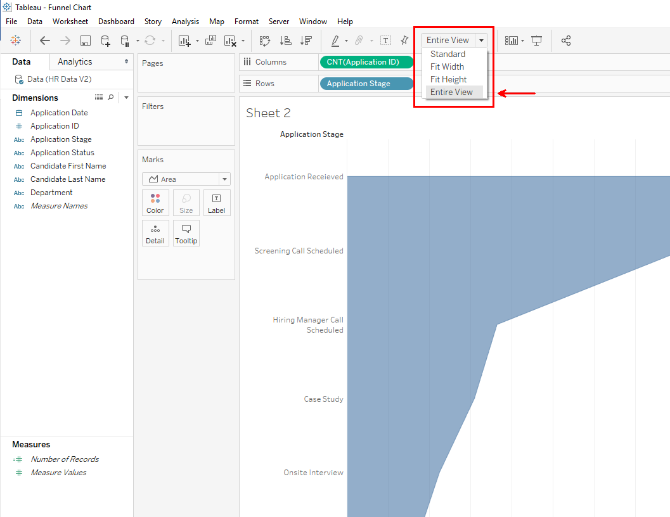
Step 5: Change the view fit from Standard to Entire View.

Tableau Funnel Charts: Change View

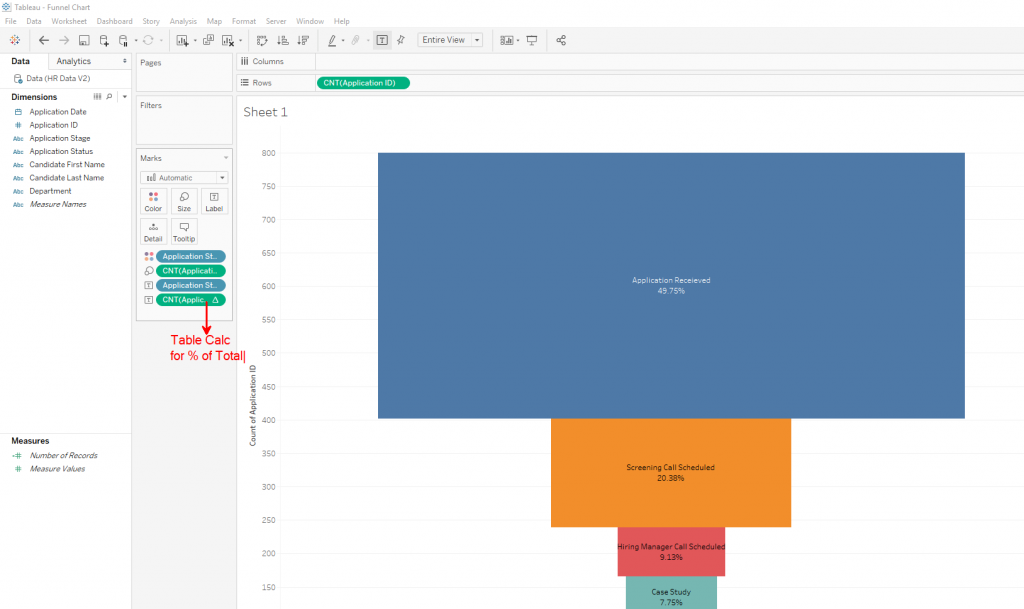
Step 6: Add labels and format the chart to your liking.

Tableau Funnel Charts: Label and Format

Smooth Funnel Chart

Step 1: Set the default sort order for the stages of your data (Tableau will default to alphabetical).

Tableau Set Default Order

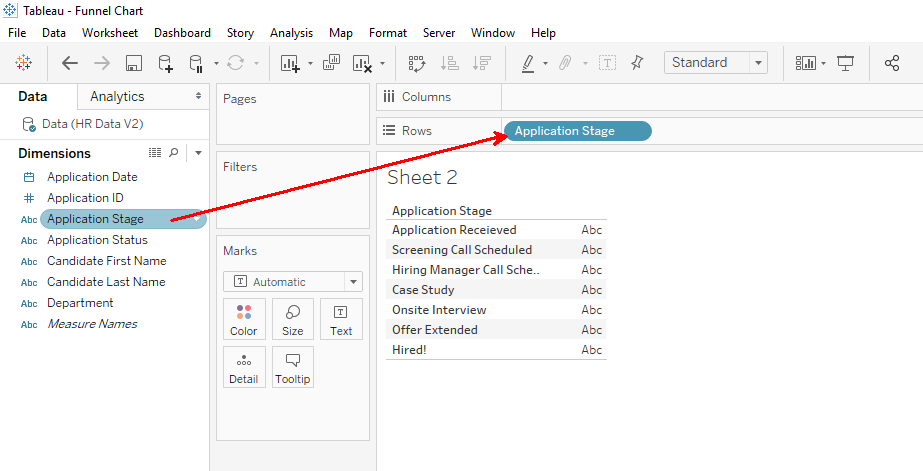
Step 2: Drag the Dimension pill, which includes your stages, onto the Rows shelf.

Tableau Funnel Charts: Drag Dimension to Rows

Step 3: Drag your Count field on to the Columns shelf and change the mark to Area Line.

Tableau Funnel Charts: Drag Fields to Columns, Change to Area Line

Step 4: Change the view fit from Standard to Entire View.

Tableau Funnel Charts: Change View

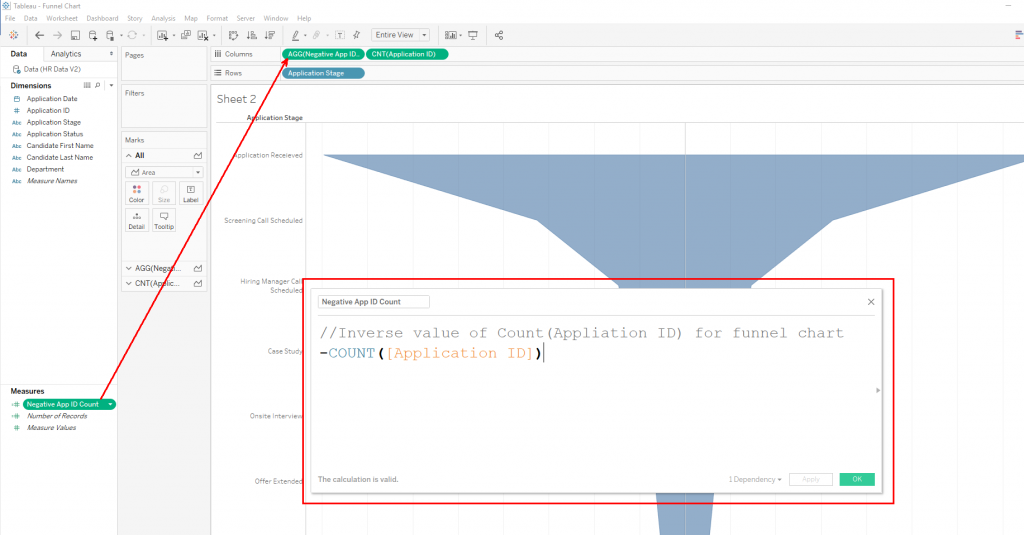
Step 5: Create a calculated field for the inverse value of your Count field and drag it onto the Columns shelf to the left of your original Count field.

Tableau Funnel Charts: Create Calculated Field

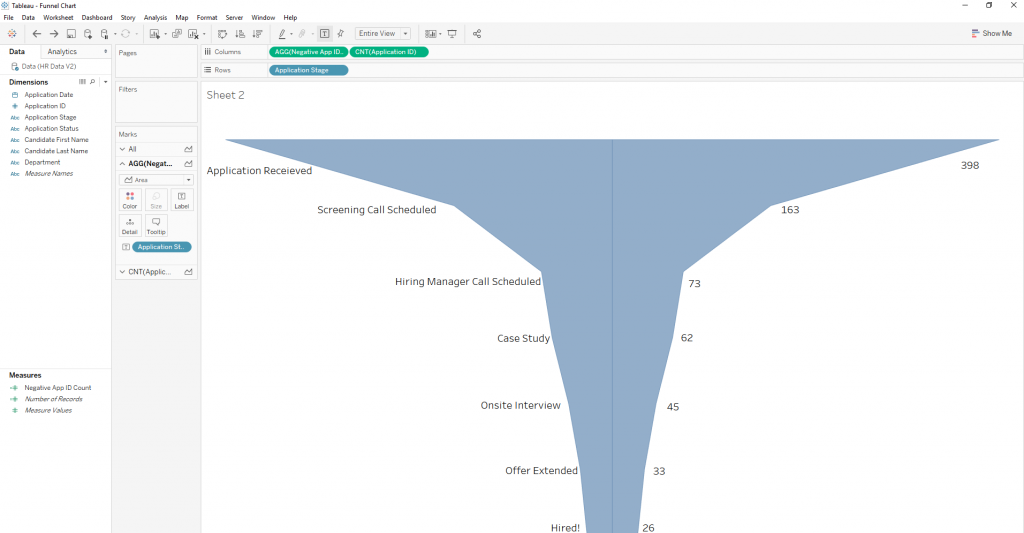
Step 6: Add labels and format the chart to your liking.

Tableau Funnel Charts: Add Labels and Format

The post Two Ways to Build Funnel Charts in Tableau appeared first on InterWorks.

Sandra Wants Your Data

$
0
0

I had prepared as best I could for the 12-hour drive home from my Son’s Boy Scout camp in Colorado. Hours of audiobooks and podcasts would be my muse, keeping me alert while transporting 15 teenage kids back to their trusting parents. A newly released pod-drama commanded my study that Saturday morning the likes of hits such as “Limetown” and “Homecoming” had previously.

Sandra,” starring Kristen Wiig and Alia Shawkat, was released by Gimlet Media on April 18, 2018, in an all-episodes-at-once offering. Listening to an audio-fiction podcast likens images of families gathered around a dresser-sized RCA on Sunday evening, intently focusing on the voice of Orson Wells as he dramatizes impending doom for cities all across the country. While the likelihood of mass hysteria is next to null, the entertainment delivered by these modern digital dramas will undoubtedly captivate and delight.

“Sandra” is the story of small-town America meets Silicon Valley when Helen starts her new job at Orbital Teledynamics and becomes the voice and brain behind Sandra, an Alexa, Siri, Google-like intelligent personal assistant. It is quickly revealed that the Sandra assistant is actually a conglomeration of humans, each versed in an extremely specific topic. When a user asks a question about birds, for instance (Helen’s area of knowledge), the session is routed to a specific, not-so-artificially-intelligent human to answer the query. The voice of the human counterpart is digitized and sent to the user allowing them to believe they are speaking with a computer, not a woman from Guymon, Oklahoma, sitting in a massive facility in the great Panhandle plains of the central United States.

Highway Outside of Guymon, OK

Above: The lonely highway just outside of Guymon.

Helen, turns out, has an incredible ability to not only answer questions about birds but to develop a relationship with the user she is conversing with. This is encouraged by her mentor/manager because it ironically humanizes the computerized assistant to the customers leading to more acceptance and ultimately, more data collection. And that right there is why I am even talking about a podcast on an information technology blog.

As it turns out, data collection is the modus operandi of Orbital Teledynamics. Each time a user purchases something at a store, each time they travel to a new city, each time they search for something on the internet, that data is collected and stored. This affords OT unique vision into a user’s life and habits and shapes the storyline of “Sandra” going forward. In an attempt to avoid several spoilers, Helen violates the one rule of OT: Never INITIATE the communication with the user. She is only allowed to receive user-originated connections. When she reaches out to the former girlfriend of a user on her own accord, a series of events are triggered that bring into question how the data collected by the companies should and is used to control our lives.

Sound Familiar? Think GDPR.

No doubt your email inbox has been flooded with privacy policy updates over the last month or more in response to GDPR, the General Data Protection Regulation. The GDPR forms part of the data protection regime in the United Kingdom, all part of the Data Protection Act of 2018. Essentially, the GDPR was conceived to give individuals in the European Union certain protections in regard to personally identifiable information, or PII. All personal data collected by a company or entity must be clearly disclosed as well as how long the data will be retained by that company, how it is shared with third-parties, and their ultimate purpose for collecting and housing that data.

Undoubtedly, you have received GDPR updates to privacy policies and you do not live in the European Union. Most companies find it easier to update their policy in a more general sense rather than have specific documents for Europe and other countries. If you received a GDPR update, that company most likely does work in the EU, and you are reaping the benefit of the more open model of data disclosure.

Each time you search the web, each time you summon your Echo or activate Siri, you are handing over information to the companies that provide those services to you. It is no mystery that Facebook and Google can and do provide their services for “free” because they are using our data for their monetarily gain! Targeted ads and suggestions are just on the surface of what can and is most likely being done with our data.

Here’s What You Can Do

We are in a unique time with the GDPR, and I want to encourage you to take advantage of this window. Go back through your email trash and find the privacy policy update emails that you previously ignored. If you received one from a company, your email is on file. Determine if you need that service any longer and if not, contact the company to remove or close your account. If you feel a company has or is doing something illicit with your personal data, you have the right to request erasure of your data. All of the details must be laid out in the updated privacy policy. Take the time to read the privacy policies and see what information is being collected from you and what is being done with it. Make the determination if it is worth the price.

Data is a massive industry and is only going to grow. Here at InterWorks, we consider ourselves a data company because we assist companies with storing, harvesting and visualizing data in the technology world. We are also all users of technology that do not wish to see our personal information end up in the hands of someone who wishes us harm. While regulations may change, it is still on you, the consumer of the service, to protect yourself. Be familiar with how your data is being used by companies and consider that each time you sign up for a “free” service, there is most assuredly a cost hidden in the fine print.

The post Sandra Wants Your Data appeared first on InterWorks.

Tableau Server or Online? ServerCare Is the Best of Both.

$
0
0

Tableau Server is the enterprise platform software for publishing, securing and distributing the content (dashboards and data sources) created by Tableau developers. It can be installed on a standard Linux or Windows Server in your data center, private cloud or public cloud (AWS, Azure, etc.).

Tableau Online is Tableau’s SaaS offering for Tableau Server. You choose from one of seven fully managed, multi-tenant environments (five in the U.S. and two in the EU) where you simply publish and access your content. There is a very limited amount of configuration and integration options available, but what it may lack in flexibility for some organizations, it makes up for in simplicity and ease of use for others.

Adding Managed Services into the Mix

To help achieve the best of both worlds, a managed services provider can be engaged to deploy and administer your dedicated (single-tenant) Tableau Server on a public or private cloud of your choice or in your data center. InterWorks offers managed services through our ServerCare program. These services include environmental monitoring, timely support (with SLAs), quarterly health checkups by Tableau Server solutions architects, OS patching, Tableau upgrades and adoption reporting.

As part of that process, choosing the network location of your Tableau Server is an important decision that should be approached thoughtfully. With each Tableau Server Rapid Start we do, we emphasize two questions to help determine where the Tableau Server should be located.

    1. Where is your data?

      • If it’s behind a firewall, either the Tableau Server needs to also be behind this firewall (usually recommended) or a firewall exception needs to be made for your Tableau Server in a different data center to query against your databases.
      • Consider network latency and bandwidth constraints between the data sources and Tableau Server. Locating your Tableau Server in a different data center than your data source can introduce additional constraints as data has to travel over the internet, usually at slower speeds.
      • If the Tableau Server must live outside the data center with your databases and an inbound firewall exception cannot be made, there are ways to automate the refresh of data on Tableau Server, but they introduce additional process complexity and development time.
    2. Where are your users?

      • If your Tableau Server end users (dashboard consumers) are all going to be on your network (physically or via VPN), then it makes the most sense for your Tableau Server to live there also for maximum security and network speed.
      • If one or more of your end users need to access Tableau Server via the broader internet, then there needs to be a path (via a reverse proxy or load balancer) to port 80/443 on Tableau Server. Tableau Server should not be directly accessible via the internet.

    Learn More About ServerCare

    We know several people who don’t have the time to fine-tune their Tableau Server and keep it running on all cylinders. We also know others who want to go beyond the scope of Tableau Online with functionality and integrations. We created ServerCare to bridge those gaps, and our team has the knowledge to turn your Tableau Server into the streamlined, centralized content hub you need it to be.

    With us taking care of Tableau Server, you can focus on the reason you bought Tableau in the first place: creating beautiful, informative visualizations to help your organization succeed. If you’re interested in learning more, head over to our ServerCare page.

The post Tableau Server or Online? ServerCare Is the Best of Both. appeared first on InterWorks.

PYD61 – Alteryx Inspire 2018 Recap

$
0
0

It’s officially conference season!

Following up our TC2018 Europe previews (Part 1, Part 2), we’re wrapping up Alteryx Inspire 2018 with InterWorks’ Alteryx Practice Lead & Alteryx Ace Michael Treadwell and Analytics Consultants Chris Sanders and Russ Lyman. The team came back with some great highlights and interesting takeaways into the future of not only Alteryx but data visualization tools altogether. Check out this week’s episode for all that and more.

Subscribe to Podcast Your Data through iTunesStitcherPocket Casts or your favorite podcasting app.

The post PYD61 – Alteryx Inspire 2018 Recap appeared first on InterWorks.

Tables in Tableau: Jazzing It Up with a Purpose, Part 2

$
0
0
Tableau Tables: Colour the Row

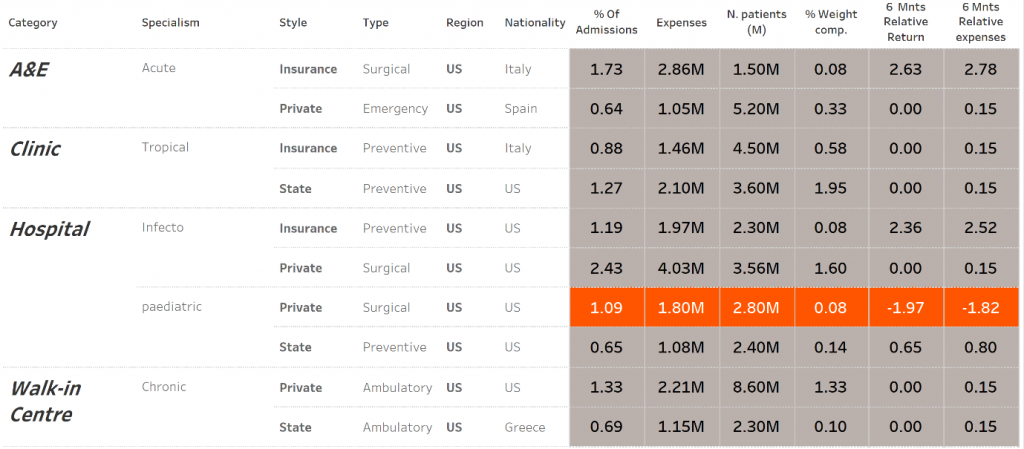
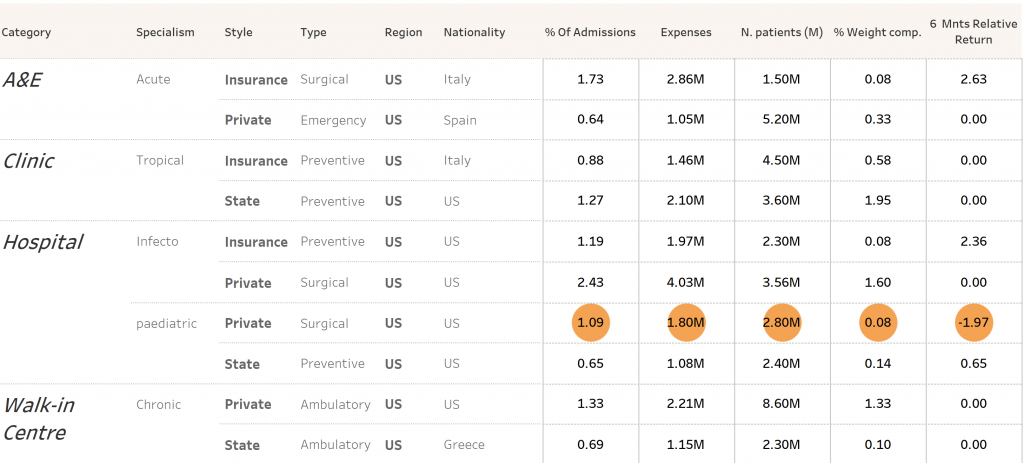
Following the previous blog post, today we will be covering several ways to display negative values in tables.

My go-to option is to add colour to the visualisation to highlight the values that need attention; however, there are different ways we can use colour. As in any other type of analysis or visualisation, we must always keep in mind the purpose and audience.

Option 1

Use of colour to show negative values when the table displays more than one measure.

Use Case: The aim is to colour the row if any dimension is negative.

Tableau Tables: Colour the Row

How to?

  1. Create a table with the data you wish to display.
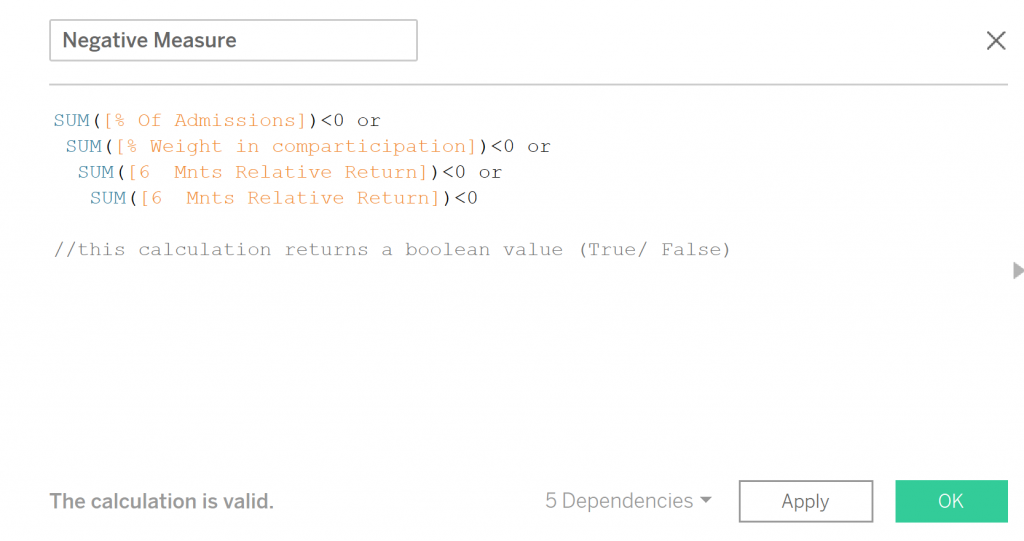
  2. To colour a row where all the measures follow the same condition, we must create a discrete calculated field with the conditions we want to be highlighted, like so:
    Negative Measure Calculated Field
  3. Add the recently created calculation Negative Measure to the Colour Marks card, and change the mark type to Square.
  4. As we did on the Part I blog, resize the square so the colour fills all the corresponding cell. For this use the slider to the maximum size.
  5. Create an empty field so we can have a separation between the cells. To do it so, double-click in an open area on the Columns shelf, type two quotation marks and hit the Enter key:
    Create Empty Field
    Hide the headers of the blank dimension by right-clicking on the newly created dimensions and deselecting Show Header.
  6. Format the colours, headers and font using the Format pane.


Option 2

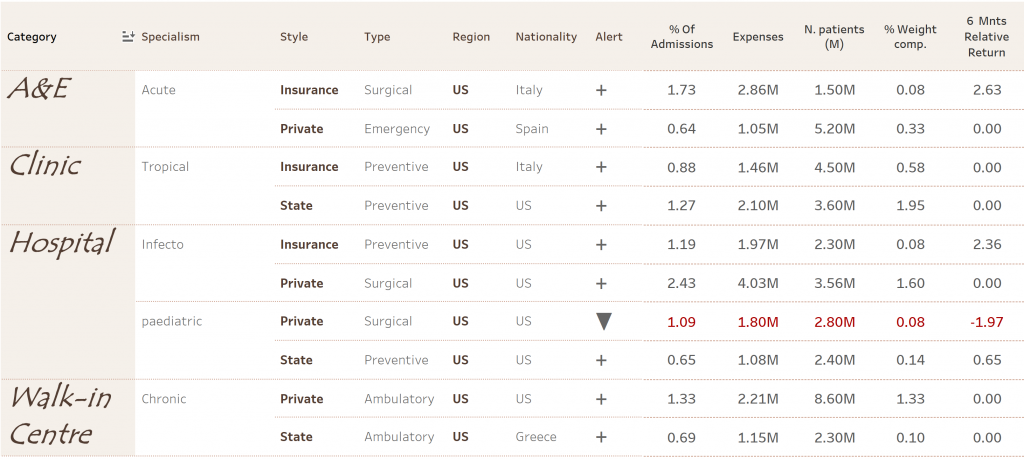
Use of colour and ASCII code to show negative values when the table displays more than one measure.

Use Case: The aim is to colour the row if any dimension is negative but without overwhelming the end user. Simple and sleek tables.

Colour and ASCII Code in Tableau Tables

How to?

  1. Follow steps 1 and 2 from the Option 1 table
  2. Add the recently created calculation Negative Measure to the Colour Marks card
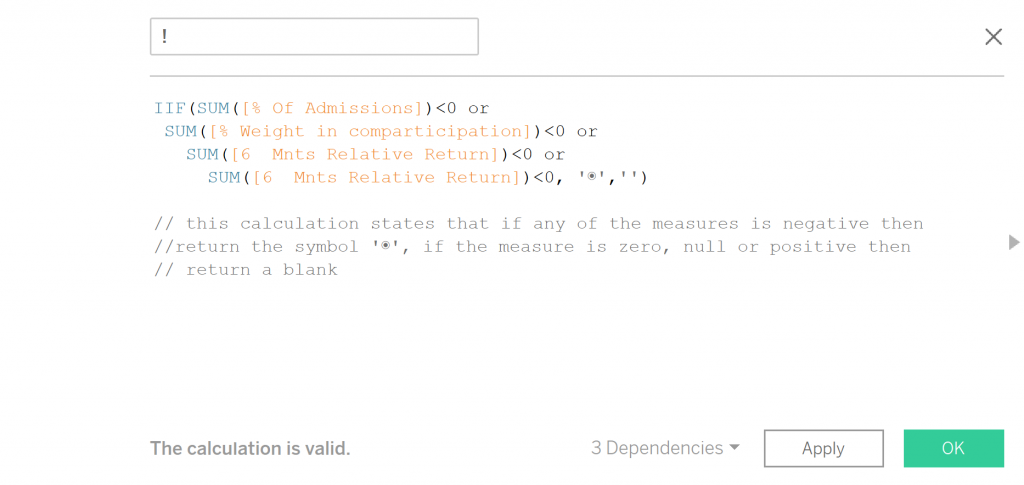
  3. Add the ASCII code:UASCII Alertse of ASCII code as an alert (!) where it is only present when any measure has a negative value.For this we need to create a calculated field where we state that if any measure is negative, return ◉. If not, then blank. Like so:
    Create Calculated Field for Negative Vlaues
    Note: To add the ASCII, I just go here and copy/paste it in Tableau (in the calculated field).▼ + Use of ASCII to not only show negative values (▼) but also positive values (+).

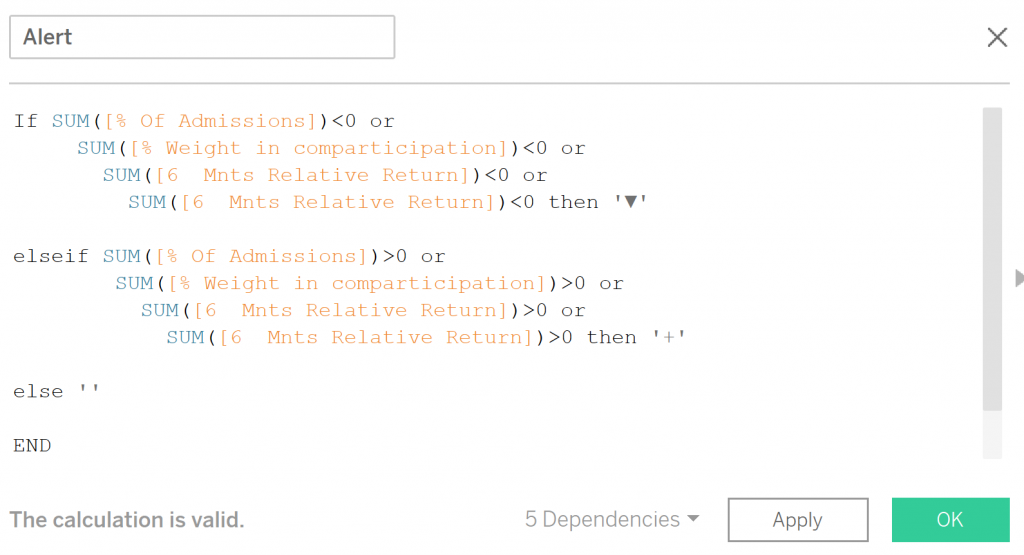
    For this, we need to create a calculated field such as:
    Alert Calculated Field
    This calculation states if any of the measures displayed has a value inferior to zero, then show ▼. If greater than 0, then show +. For the remaining options (null or =0), leave it as a blank.

  4. Add the new calculated field (! or Alert) to the rows.
  5. Format table using the Format pane (right-click anywhere on the view, choosing Format).


Option 3

Use of colour and shapes to show negative values when the table displays more than one measure.

Use Case: The aim is to colour the row if any dimension is negative but without overwhelming the end user. Simple and sleek tables.

Use Colour and Shapes in Tableau Tables

How to?

  1. Create a standard table.
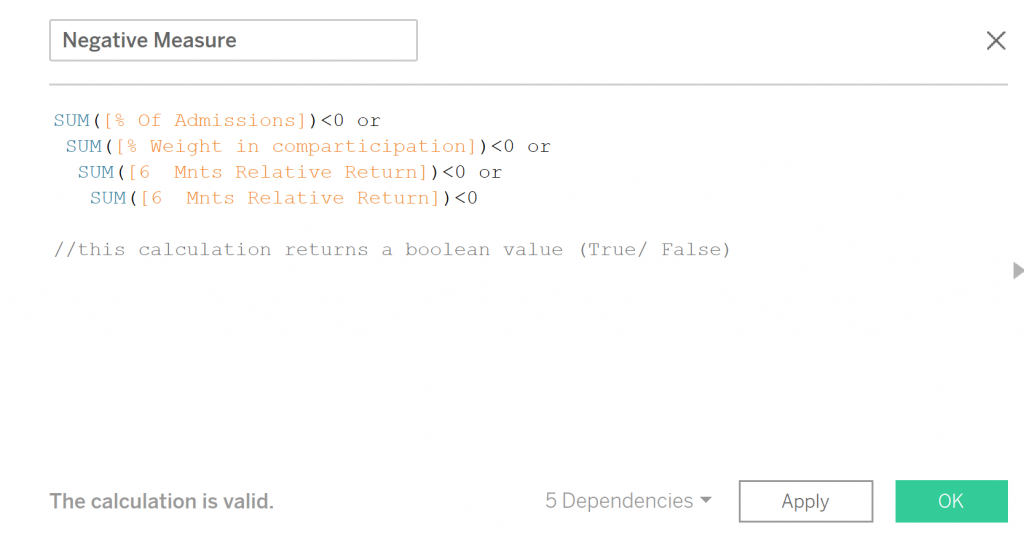
  2. To be able to use two types of shapes and two discrete colours, we need to create a calculated field like:
    Negative Measure Calculated Field
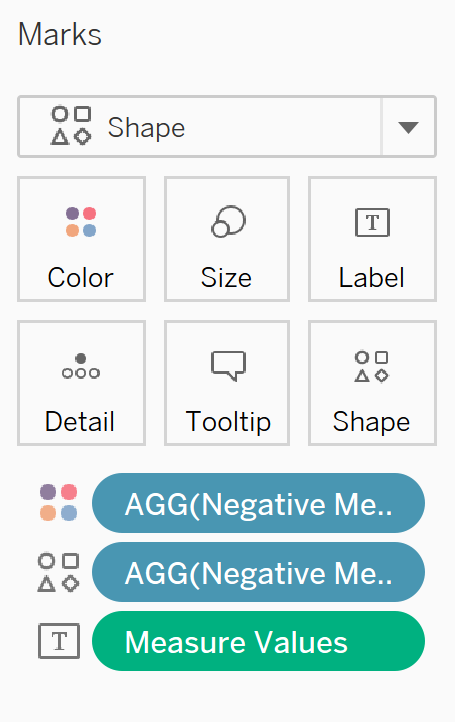
  3. Add this new calculated field Negative Measure to the Colour Marks card and change the mark type to shapes. Drag the same field once again, but this time add it to the Shapes Marks card.
    Add to Shapes Marks Card
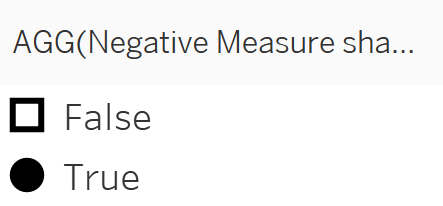
  4. For the shapes, choose a filled shape for negative values.
    Choose a Filled Shape
    Fill Shape on the Worksheet
  5. Change the colour of the hollow shape, matching the background of your worksheet/dashboard.
    Change Shape Colour on Worksheet
  6. Format table as needed.


Stay tuned! In Part III, we will cover table and chart combos.

The post Tables in Tableau: Jazzing It Up with a Purpose, Part 2 appeared first on InterWorks.

Advance with Assist: Enhancing Dashboards with Custom Icons

$
0
0

This week’s question came from a longtime Tableau user, but they just aren’t happy with the way their dashboard looked:

“The attached dashboard just doesn’t have the bang that I’m going for. Any tips you can think of to enhance it? There are maps with the issue location and the visits associated with the corresponding speed to resolve with the technician?”

As with many things, I can’t share the dashboard of the client due to data confidentiality, but they did give me permission to share what we did. As eluded to in the question, they had a dashboard of maps for the client issue location and the response/validation done by the technician.

In a quick-glance test, they couldn’t see what they needed to focus on quickly. It took management longer than they’d like to get at the information, even though it was presented well. It was decided to pull in our in-house designer, David Duncan, who has a really uncanny ability to create really impeccable custom iconography.

How We Used the Icons

With the client, we decided to call out the locations using a custom site pin. We then added a watch face for “time on site” that would adjust in color if time was greater than average on the technician pane.

Location Marker

Time On Site

The last icons we created were based on the customer feedback. This was tied to location. If anyone ever fell to the lowest level, it triggered a follow-up to that customer base.

Gauge 1

Gauge 2

In this scenario, we used dashboard Shapes on the Marks card.

Since we wanted to be able to color the shape based on a KPI, this allowed the dashboard to have custom KPI logic built into the Color card as well.

Want to Add Your Own Shapes?

You might be thinking the use of custom iconography is all well and good, but perhaps you’re not sure how to add custom icons to Tableau in the first place. The process is easy, and there are two great InterWorks blogs that show you how it’s done:

  1. Using Custom Shapes in Tableau
  2. Tableau Essentials: Formatting Tips – Custom Shapes


Reach Out for More Info

This was a fun question with an even more fun process for both the client and InterWorks. If you have questions like this, or really any question about Tableau, then get onboard with InterWorks Assist.

Learn More

The post Advance with Assist: Enhancing Dashboards with Custom Icons appeared first on InterWorks.


The Internet Will Eat Me: Part 1 – Email and Browser Settings

$
0
0

This started as a short blog on my paranoia and quickly escalated. I am breaking it into two parts, describing a small piece of my exaggerated plunge into the depths of personal data security on the internet.

If you read my last blog, you may have witnessed something profound. A few days after the last keystroke on the piece, what started as a “book report” on a podcast I had binged the previous weekend, I began a slide into a dark, scary place. The place I found myself tumbling into (slowly at first, then at terminal velocity) was that of the security of my personal information on the internet. Even the typing of those words solicits a chill down my spine, a numbness in my spirit, a lack of will to even continue with this blog. Alas, my experience should be documented. Not only because the rules of data will probably change again in the coming months, but because, just maybe, my paranoia will make your life that much easier and safer.

Spurred by the GDPR

In my last piece, I discussed the GDPR. I am not going to dig deep here, you can just Google (or not, more on that later) the GDPR and learn anything you want to know about the European Union’s new policy that ultimately affects us all. The takeaway here is that the GDPR is (probably) good. It makes the data collected by companies visible and available to us. The question I ask myself now that the information is more visible:

“What do I do with that?”

This is by no means a compressive list of things you must or should do to protect yourself. This is intended to get you started on your journey of internet security. Someone could work days, months, or even years and never completely shield themselves from the massive data-suck that is the internet. The following experiences I describe are meant to trigger your desire to protect your own information. You must ultimately be in control of your digital life and the level of paranoia you allow yourself to experience.

Cleaning Up Email

The first thing I did was open my email deleted items folder, as I described in that previous blog. A quick search for “Terms of Service” turned up, well, nothing actually. “Update,” nope. “GDPR,” nada. This was going to be more challenging than I thought.

GDPR Email Search

A quick scroll to the bottom of the folder revealed the problem. No messages older than a week were in the trash. Clearly, a previous settings purge was responsible. Lesson one: Pay attention to your email before you delete it.

Unable to heed my advice from the previous article, I resolved to be more diligent on the messages I receive each day and determine one by one if I need that online account. After perusing my junk mail and deleted items and monitoring my inbox for a few days, I was able to close out or unsubscribe from many services that I no longer use. Apple Mail has made it easier to unsubscribe by adding a banner to the top of a message they detect as a mailing list.

Mailing List Banner in Apple Mail

Gmail has a similar feature.

Gmail Unsubscribe Feature

Almost immediately, my inbox was staying cleaner, clearer and under control! Each day, I get less and less spam, and while it may not be doing much for my online data, it is making me feel less cluttered and freer.

While I was logged into my email, I verified that two-factor authentication was turned on. 2FA, as it is often referred, adds a layer of protection to your accounts. Many services are migrating to 2FA availability, including banks, social media outlets, blogs, etc. Two-factor authentication usually works by sending a code to a mobile device via SMS or with an app. You must then enter that code on the website before you can log in. This obviously adds an extra layer of protection for your identity and data on these services. If it is available, you should turn it on.

Apple recently turned it on for all iCloud customers by default. You can get all the details on Apple 2FA here.

Gmail does not have it on by default, but a few clicks had me quickly secured. I also changed my password, as it had been over 1.5 years since it had last been done.

Gmail Password Settings

Gmail 2FA

Tweaking Additional Account Settings

With my email accounts secured, I moved on to additional account settings. Google has a few tools that you should take advantage of. The Privacy Checkup tool walks you through a wizard that allows you to determine what information you want to share with Google and the world. It is obviously up to you what you want to share.

You should read about each of the settings and whether or not turning it off will affect your normal workflow. While many of the items are clearly used for marketing and ad targeting, some are used in apps such as Google Maps and YouTube and turning it off could cause issues. Make a note of everything you disable so you can revert if the need arises. In my paranoia, I disabled everything for now.

Google Privacy Checkup

I also deleted my Google+ account. I honestly had completely forgotten about Google+. My last post was a link to an article about the Shake Weight in 2011. I don’t think having the G+ account is doing me much good at this point.

Deleting Google+

Revisiting Browser Settings

After about an hour of clicking around, I felt somewhat better about my Google settings. I stopped using Chrome a few months back for no reason other than some specific sites I visited stopped working with a recent update. Chrome is the dominant web browser of the world with over 62% of the desktop market share. No one even comes close to that number. It is a good browser and has served me well for years, but it has a history of privacy issues that should solicit pause (Source 1, Source 2 …). It is produced by Google, and as with anything Google, ad revenue and data collection are the primary goals. I switched to Mozilla Firefox because of their openness and dedication to internet security and protecting your data.

I did not just install Firefox and forget it, NO! I am a paranoid android and I want to be as secure as possible. Here are a few things I did to protect myself in Firefox:

  1. I started by changing my default search engine to DuckDuckGo. Simply stated, DuckDuckGo is a search engine that does not track you.
  2. Second, I installed a browser extension called HTTPS Everywhere. This extension forces websites to use HTTPS and encrypt the traffic flowing back and forth from the site.
  3. I use private windows or Incognito mode, as it is called in Chrome, when possible. When you use private browsing, the browser does not save data from the sites you visit. They are very clear to point out, a private window does not make you invisible on the internet. You should not use the setting thinking you are anonymous.
  4. Enable tracking protection in Firefox. This setting blocks the sites from collecting information about you for their own gain.
  5. Finally, browse the settings of your browser, particularly the Privacy and Security section. Adjust your settings as you see fit but understand that some things will break certain websites. As I suggested above, note what you change and revert if needed. I found that disabling all cookies made doing my job difficult, so I reverted the setting but chose to have it clear the cookies each time I close Firefox.


Again, these suggestions are not a compressive, must-do, end-all-be-all, cure-all-ills docket of obligatory actions. Your experience with each setting will vary and should be consumed with trepidation and trial. Document your changes, revert if something does not work and read/research on your own.

In part two, I will dive even deeper into despair as I attempt to curtail the dreaded social media monsters.

The post The Internet Will Eat Me: Part 1 – Email and Browser Settings appeared first on InterWorks.

InterWorks Blog Roundup – June 2018

$
0
0

Let’s be real: It’s too hot to go outside right now, so why not stay in the A/C and catch up on some reading? June featured our usual variety of useful Tableau tips as well as some really topical vizzes ranging from the World Cup to LGTBQ Pride. And what’s that? Snowflakes in June? That’s right! We even have a few posts about our favorite cloud-based data warehouse. Oh, and let’s not forget that Tableau Conference Europe 2018 just went down. There’s a lot to catch up on, so dig in!

News and Events


Tableau Tips and Tricks


Tableau Vizzes


Portals for Tableau


All Things Data


Podcast Your Data!

The post InterWorks Blog Roundup – June 2018 appeared first on InterWorks.

A Quick Overview of Embedded Analytics in Portals for Tableau

$
0
0
Portals For Tableau

At InterWorks, we live and breathe Tableau. It is an awesome product that helps us to analyse data, draw insights and share them across all types of businesses and industries. Over the last few years, however, clients had been asking us for a public facing embedded analytics solution. Portals the platform was born!

What Are Portals for Tableau?

Portals for Tableau use Tableau Server functionality and licensing through a totally customisable web interface to present your dashboards in a secure and familiar way.

Tableau Server is great for people who have years of Tableau experience and attended trainings, but sometimes can be hard to use and navigate for people with little experience or senior management with limited time to play and learn.

Above: An example Tableau dashboard embedded in a portal.

What Are Embedded Analytics?

In Portals, embedded analytics embed your interactive Tableau visualisations in a webpage, enabling users to access, filter and drill down easily.

Everything outside of the visualisation (colours, logos, navigation, etc.) is controlled by the website. The webpage can function differently to Tableau Server; in fact, you don’t even have to know it is Tableau! But rest assured, the visualisations will act the same as in Tableau as they are coming direct from the Server.

Why Use Portals?

  • Easy to use – Portals have a clean and familiar “website” feel where no instructions are needed. It is simple and easy to find what you are looking for.
  • Totally customisable – Anything can be customised: logos, colours, font and placement. You could decide to move your menu from the top to the side, you could insert a fun GIF, corporate video or text, add custom tabs or a custom loading screen.
  • Consistent with brand guidelines – This reporting platform can have your company logo; your client doesn’t need to know that they are viewing visualisations built in Tableau.
  • Favourite dashboards – Users can tailor their own Portals experience by using gold stars to favourite dashboards that might be of particular use and interest to them.
  • Related content – There’s even an action to show content that is related to the dashboard the user is currently viewing. This can make it easier for users to dive deeper into the data.
  • Search function – Users can search within dashboards on Portals, pages in Portals or external pages. This just needs to be set up using indexed keywords. Will your users still need to view legacy reports for a short time? You can help them to navigate towards those reports.
  • Exportable – Easily export visualisations to PowerPoint or PDF using a template so that branding is consistent with other communications. Yes, Tableau dashboards were made to be interactive, but businesses still use printed reports, so InterWorks are responding to that common business request.
  • Resetting filters – You can reset all filters at once taking you back to the starting visualisation.
  • Dynamic parameters – One of the biggest ideas on the Tableau idea forum is dynamic parameter functions, meaning that if your data changes, the parameter values should too. Portals can do that.
  • Pop-out menu – Save much-needed space on your dashboard by utilising the pop-out filter/parameter menu in Portals.
  • Sticky filters – Filter and parameter selections can follow users around between different workbooks so they don’t have to repeatedly select the same series of options. A regional manager might not ever want to see other regions so this will help them to save time and focus their attention on their area of interest.
  • Data refresh timers – Visualisations can be set to refresh regularly so that users can see the latest data, for example a TV wall screen in an office might show the latest call centre statistics refreshing every 30 seconds.
  • Same great product – Fully interactive just like Server; use highlight, tooltips, select filters, etc.
  • Security you can trust – Permissions from Tableau Server: No access to Server, then no access to Portals. User authentication is tied directly to Tableau Server, so any user on Server can log into Portals and their permissions are transferred.

See Portals for Yourself

There are entirely too many wonderful Portals features to list in one blog post. I recommend taking a look at the live Portals demo to see for yourself what they can do. Of course, we’re always rolling out new features with regularity, so keep an eye out for those.

See the Portals Demo

The post A Quick Overview of Embedded Analytics in Portals for Tableau appeared first on InterWorks.

Recapping InterWorks’ London Team Day

$
0
0

When InterWorkers meet, we not only talk about Tableau and how to help people better understand their data, we also like to be challenged and challenge each other! This time, right after Tableau Conference Europe 2018, we were invited to join London Team Day.

For those who don’t know, we have a tradition of naming our teams after mountains, and the London Team is named after the highest mountain in Wales – Snowdon (El. 1085m). After reviewing the Tableau Conference and having a delicious lunch, we were ready for an adventure that Sian prepared for us: a scavenger hunt in East London.

We were divided into three teams and had two hours to finish the game. The challenge tested our Google search and map reading abilities as well as teamwork and creativity. It was great fun. Spoiler alert: We did finish on time to continue with the last part of the program. We had a tour in one of the London’s distilleries, which included gin, whisky, rum and vodka tasting. It was also a great place to continue our data talks.

Below is a short video recap of the day. If you are up for the challenge you can try the game yourself (PDF is attached). Oh, and we’re always looking for new talent to join us in London and all across Europe! Explore our open positions on our Careers page.

The post Recapping InterWorks’ London Team Day appeared first on InterWorks.

Portals for Tableau New Feature Spotlight: Dynamic Filter Updates

$
0
0
Portals for Tableau: Misc Interaction Options

Ever wish your Portals for Tableau filters could be dynamic? Or even your portal parameters? You’re in luck! You may have seen Data Driven Filters (also works for parameters) on your portal – it even made our recap of last year’s best features. Now we’re back with a pretty big improvement, for both usability and performance.

Specify Filter Sheet

You will now see a new toggle in the backend under Content > Dashboards > Edit-dashboard > Misc tab: Specify Filter Sheet.

Portals for Tableau: Misc Interaction Options

When grabbing the dynamic filter data, the portal looks at the first worksheet loaded. However, you may have multiple data sources comprising your dashboard or a slow-loading worksheet you want to avoid. In these cases, you’ll want to tell the portal which worksheet to use to populate your dynamic filters.

After you turn on Specify Filter Sheet, you’ll see two new fields immediately beneath that toggle: Filter Worksheet and Use Summary Data.

Portals for Tableau: Use Summary Data

Now you can populate Filter Worksheet with the exact name of the worksheet you want the portal to pull the dynamic values from. This will ensure you’re getting the right data from the right data source.

Use Summary Data

While the above method can now fully ensure you’re getting the right data, the default method of retrieving the Underlying Data grabs all of the columns from the Underlying Data on your worksheet. This can get pretty sluggish if you only need three or four columns to populate your filters – especially if you have a very wide dataset. Nobody likes waiting for things they don’t need.

Wait no more! You can switch on the Use Summary Data toggle to use a faster API call that only grabs the Summary Data from your worksheet rather than all the Underlying Data. Not sure whether the data you need is in the Summary Data or Underlying Data is on your worksheet? You can check:

  1. Navigate to the worksheet you plan to use
  2. Select ALL the data on the page
  3. Right-click > View Data

Portals for Tableau: View Data

For this example, I want to populate my Region filter dynamically. Since all of my values are here on my Summary Data pane, I now know I can turn on Use Summary Data.

If your data doesn’t show up here, you have two options:

  1. Add the level of granularity you need to the Detail shelf on your worksheet
  2. Create a separate dedicated “Filter” worksheet – this would simply be a crosstab of all the data you need for your filters in crosstab format


There you have it. A dynamic driven filter with more control for improved data-fidelity and performance!  Happy filtering.

The post Portals for Tableau New Feature Spotlight: Dynamic Filter Updates appeared first on InterWorks.

Tables in Tableau: Jazzing It Up with a Purpose, Part 3

$
0
0
Tableau Table/Chart Combo

We have now reached the final part of our Tableau Tables Trilogy. For this part, we will be covering what I call the table/chart combo.

Why do this? The reason is quite simple. More often than not, people consume data in a table format, spending years consuming tables in Excel, PowerPoint or even Word. So, it is only natural that their go-to data visualisation is a table. This mindset is often so ingrained into the concept of “if I don’t see all the numbers, then I can’t trust the data” that is challenging to convince them otherwise.

However, by introducing small elements such as colour, icons and charts, we can almost re-educate our brain and accept the use of visual aids.

Here is where building a table/chart combo can help us start many conversations and change many mindsets, too.

How to Do It Then?

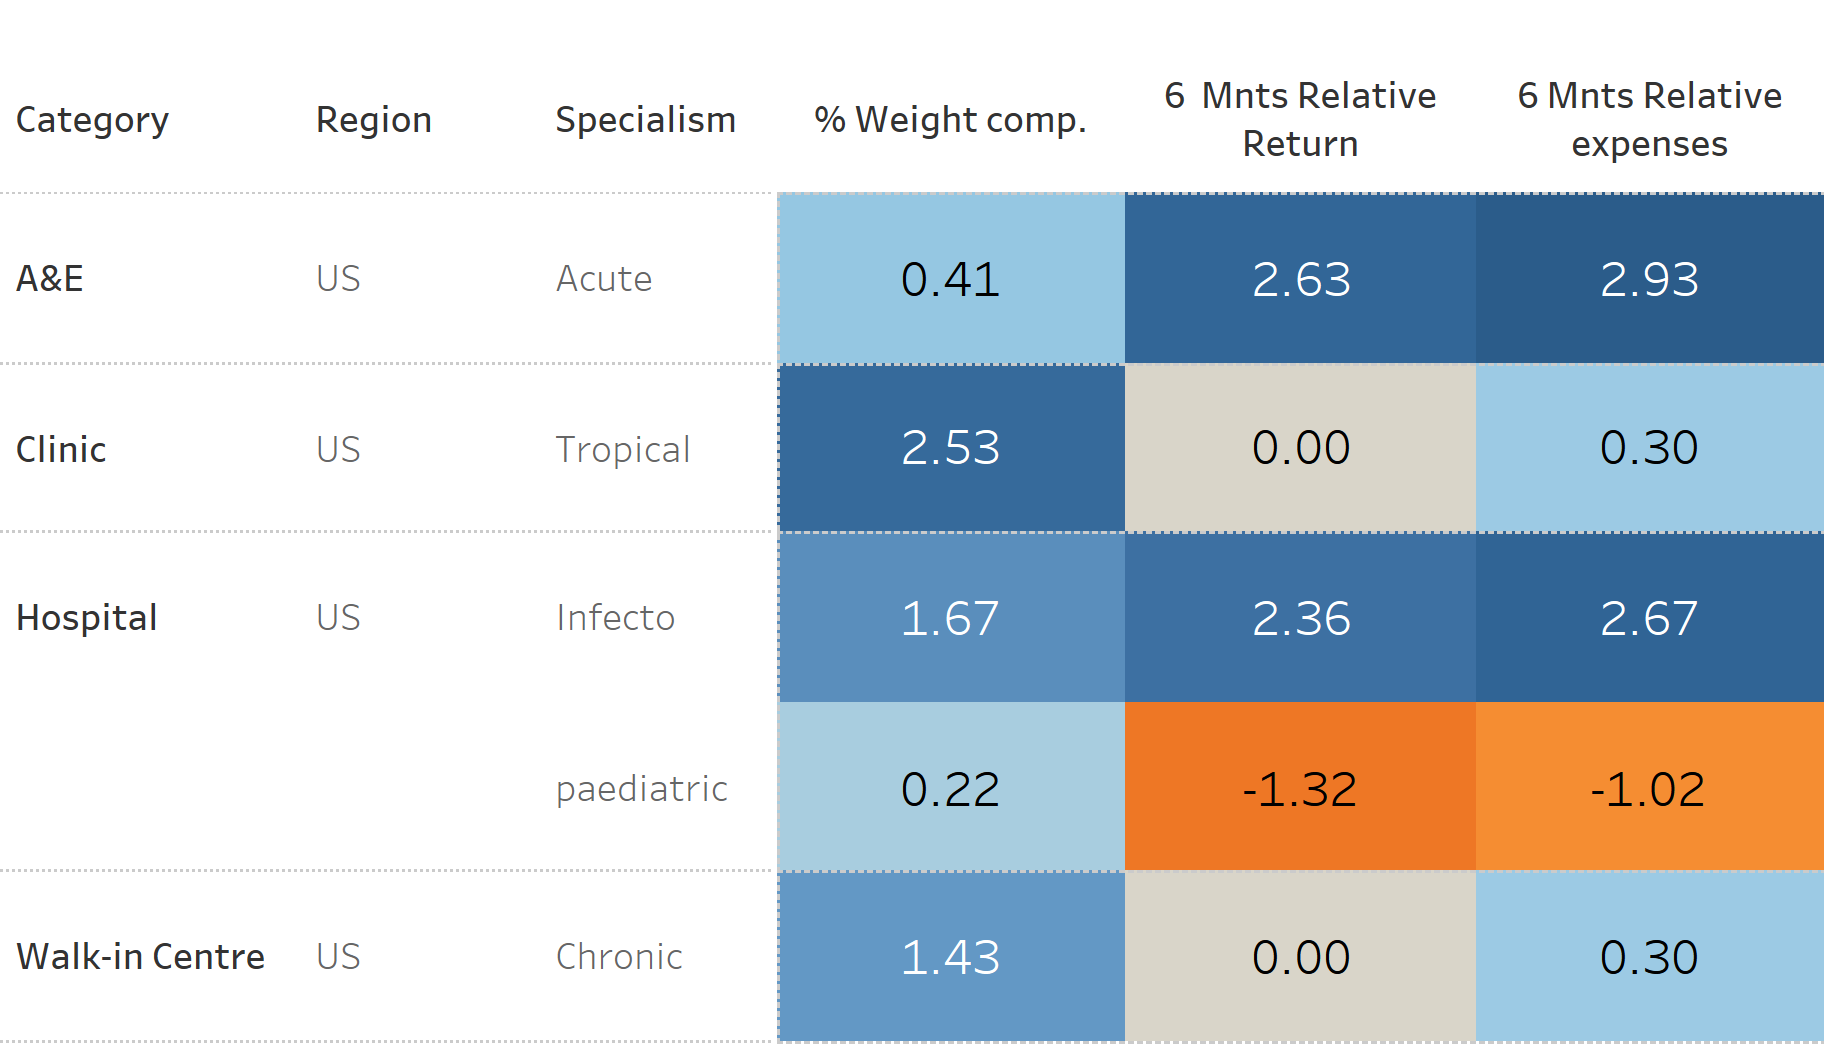
  1. Create a table with the data you wish to display:
  2. Create a bar chart:
    Bar Chart in Tableau
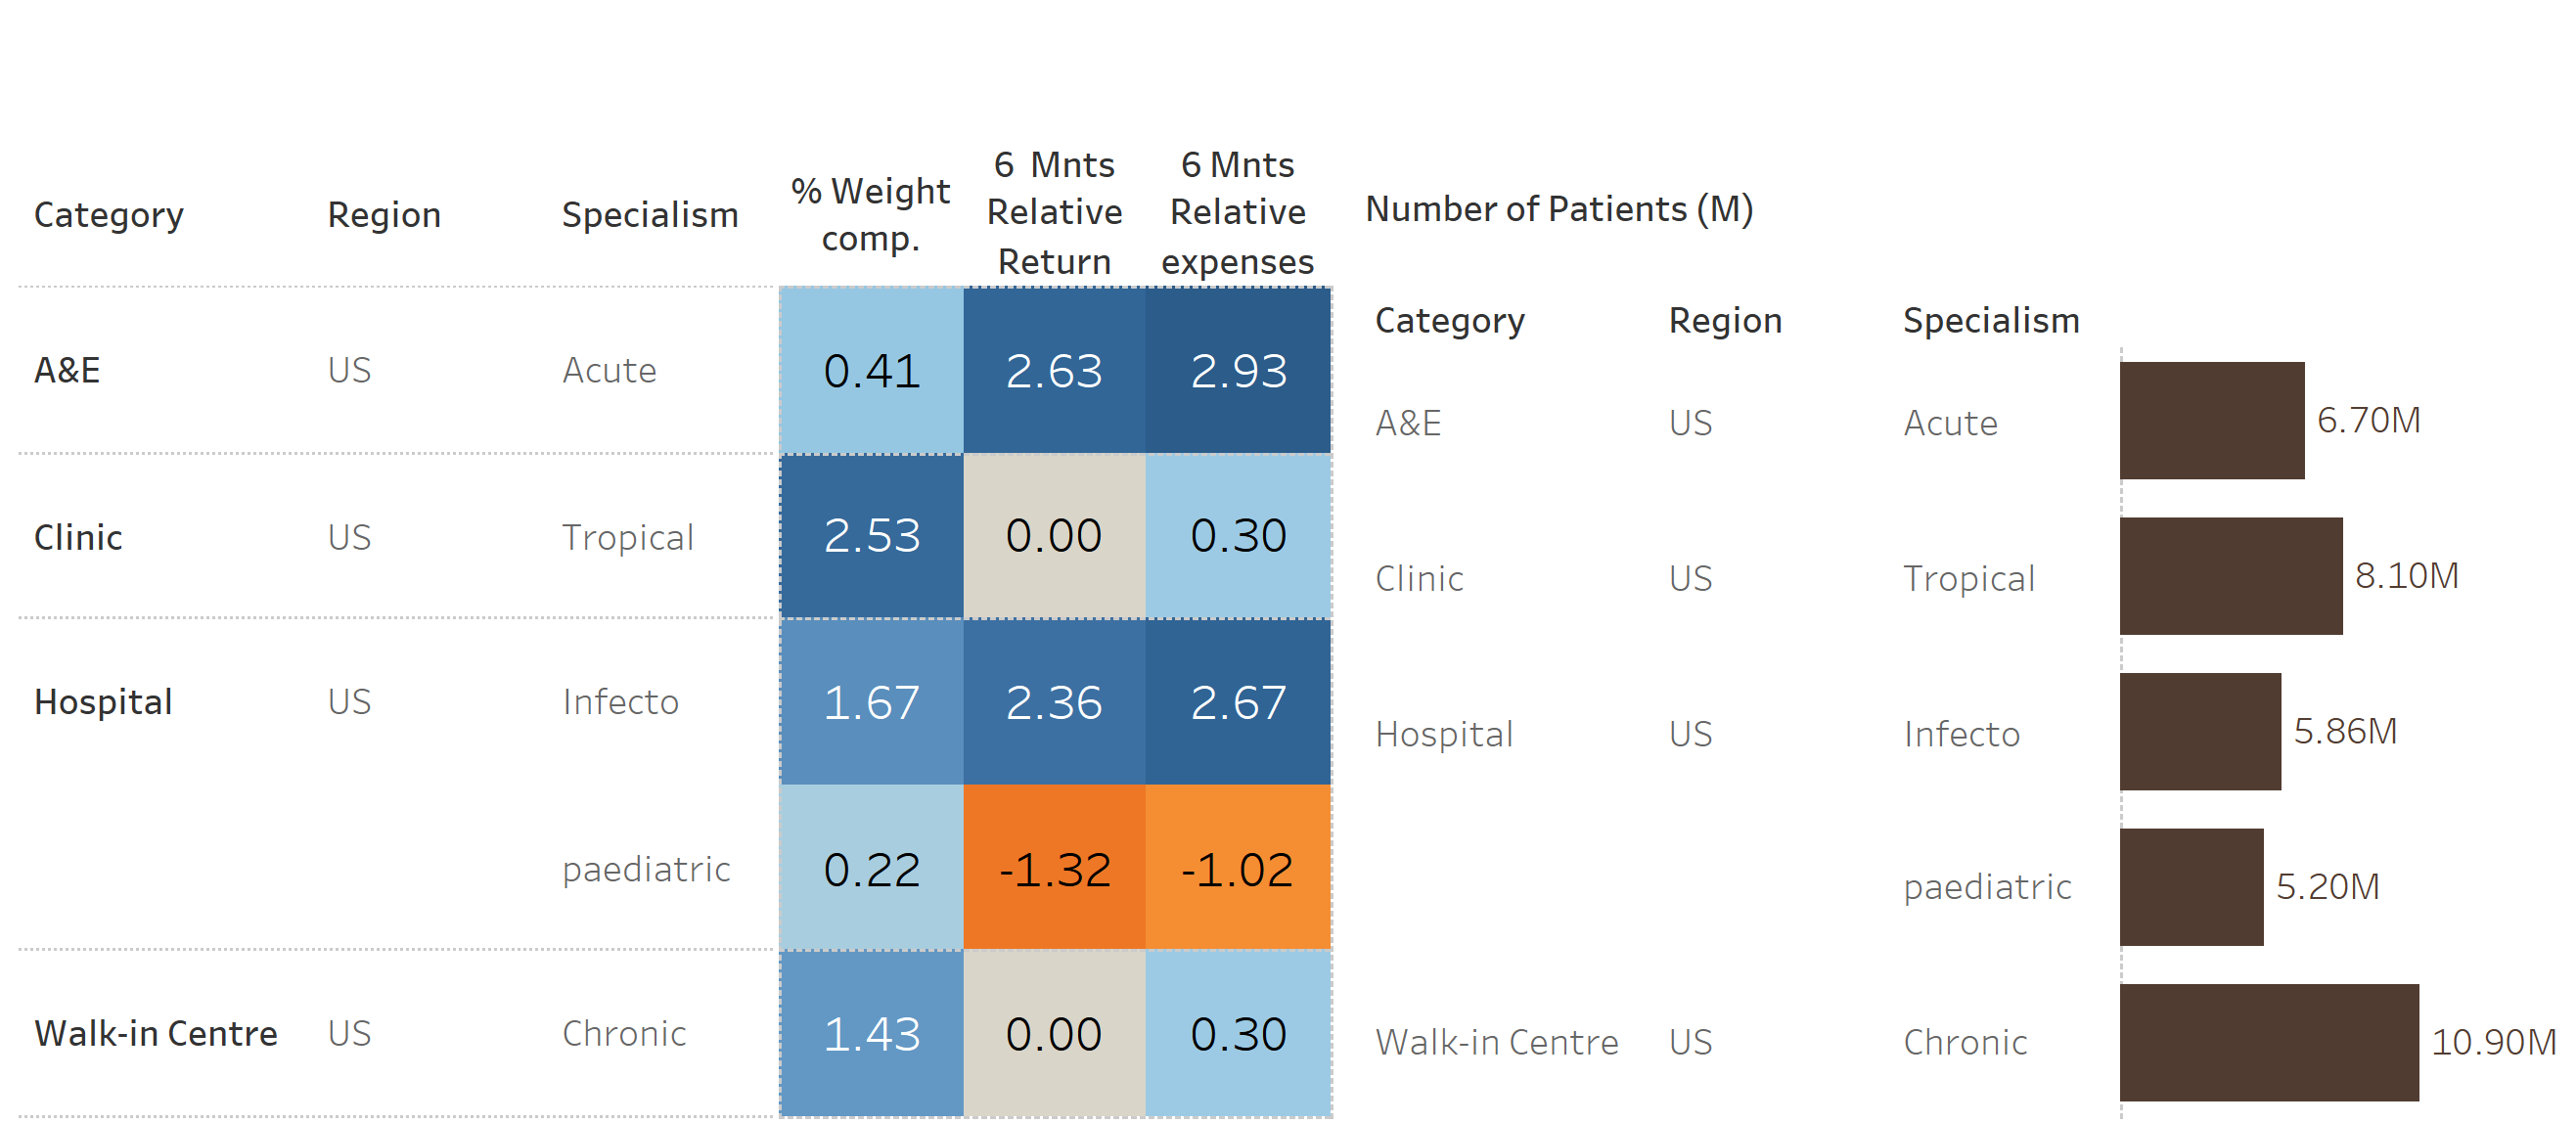
  3. In a dashboard, combine the two elements:
    Table + Bar Chart in Tableau
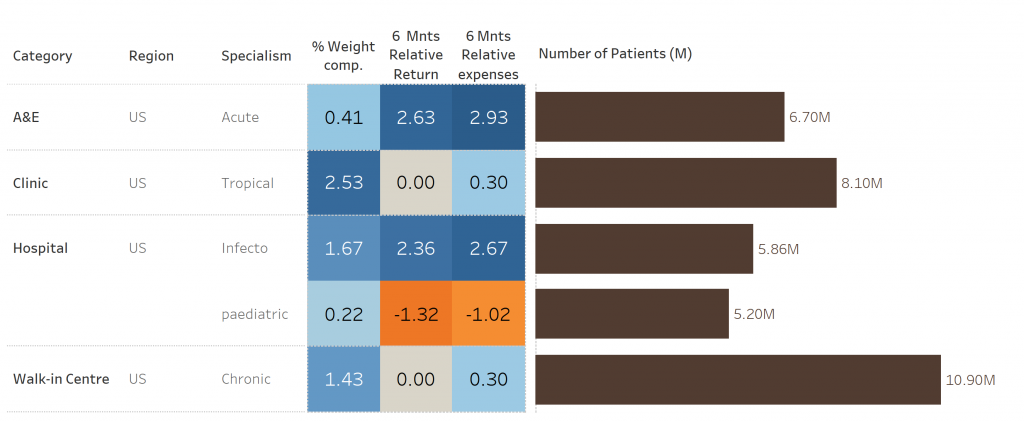
  4. Maintaining the order of the headers (categories) consistent between the two elements of visualisation (table and bar chart), we can now remove the headers of the bar chart.
    To do this, you can:
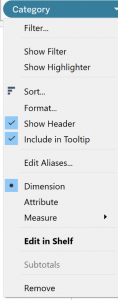
    • Right-click on the header and untick the Show Header option from the drop-down menu, OR …
    • On the bar chart worksheet, click on the character Category Drop-down of the Dimension field and untick the Show Header option from the drop-down menu.
      Show Header Drop-down
  5. Adjust the titles and fonts, format colours as preference. You can also add the highlight function across the two sheets so you can simultaneously see the elements of both sheets.

Final Tableau Dashboard

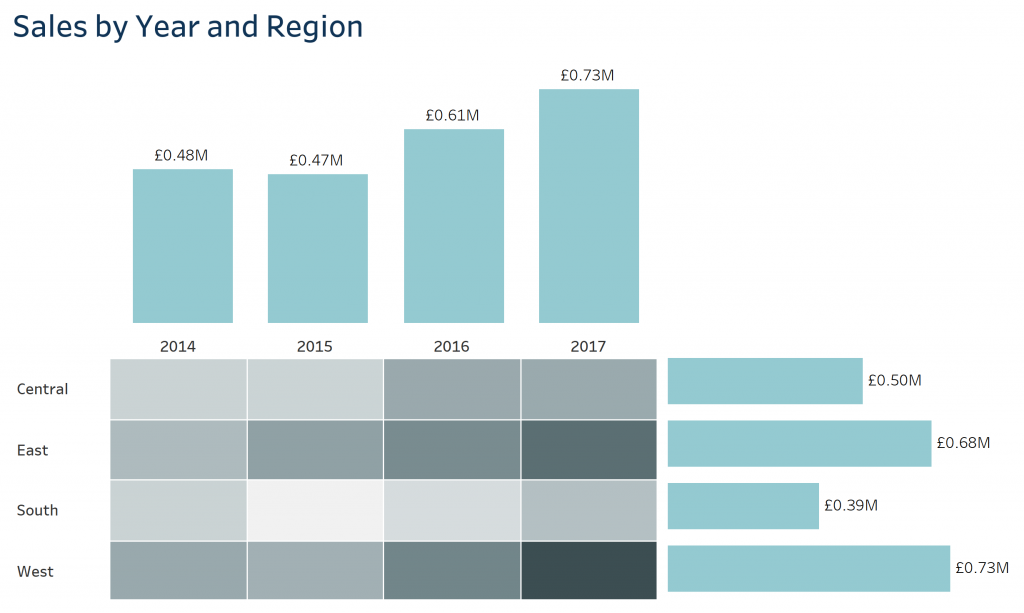
Another option for your visualisation is to use a highlight table and two bar charts like in the following example. Here the highlight table is displaying the sales by region and year, the vertical bar chart showcases the total sales per year and the horizontal bar chart shows the total sales by region:

Tableau Table/Chart Combo

Thank you for reading. If this is the first blog of the trilogy that you are reading, please don’t forget to read Part I and Part II. Happy “Tableauing” everyone!!

The post Tables in Tableau: Jazzing It Up with a Purpose, Part 3 appeared first on InterWorks.

Advance with Assist: Tableau Power Using Leaving the Company

$
0
0
Data Source Audit Results

Here’s the InterWorks Assist question for this week’s post:

“I have a situation where one of our power users left the company, and I’m having trouble finding the data connections related to them as they aren’t published connections. Is there any easy way to find everything his login is associated with to produce a list?”

I can see where this could come up often. You have many workbooks and views that are built to a connection that isn’t published, but you need to find them and produce a list so edits can be made.

Workbooks Tab

Luckily my client is an InterWorks Assist subscriber, so I can use the Data Source Audit feature from Power Tools: Desktop to look at every data connection in every workbook. I can then export this to a Tableau dashboard, Excel file or PDF. I chose a Tableau dashboard to get the below:

Data Source Audit Results

We can then click into the DataSource worksheet and add the Audit – Connection Username field to find the connection information the client was after and filter to the user he was looking for.Click into Tableau Worksheet

We can then use the Export Worksheet to Excel Option to get the list he was after. I could have also just selected the Excel Option first to get an Excel file of all the audit information, then Column Q is the Connection Username that I could filter on.

Questions? Ask Away.

This was one of many questions that can be solved with Power Tools for Tableau. If you have any questions about Tableau or just data in general, InterWorks Assist is always open.

Learn More

The post Advance with Assist: Tableau Power Using Leaving the Company appeared first on InterWorks.


5 Steps to Enabling a Multi-Select Parameter Control in Tableau

$
0
0
Final Multi-Select Parameters in Tableau

The multi-select parameter control is a feature many that Tableau enthusiasts would love to take advantage of. While the multi-select parameter option isn’t available natively within Tableau, we’ve enabled the multi-select parameter feature within Portals for Tableau! Big props to Matthew Orr and the Portals team for making this a reality.

Step 1: Create a Parameter

Create a parameter within Tableau Desktop. In this case, we’ll name our parameter [Region] as we’ll be using this to create a multi-select parameter control to filter by regions. Make sure to set the Current Value to (ALL).

Create a Parameter in Tableau

Step 2: Create a Calculated Field

Create a calculated field to control the values displayed. We’ll use the CONTAINS() function to enable multiple values to be passed in as well as the (ALL) option.

Create a Calculated Field in Tableau

Step 3: Filtering

Place the [IS_Region?] field on the Filter shelf and set the filter to only return True.

Filtering

At this point, we’ve created the framework to enable the parameter to accept multiple options; however, the free-form text control isn’t very useful in a production scenario.

Region Filter in Tableau

Set to True

Two Values Applied

This is where we’ll look to Portals for Tableau to extend the functionality of Tableau by replacing the free-form text box with a multi-select control.

Step 4: Enter Portals for Tableau

In your portal’s backend, create a new parameter by navigating to Tableau > Parameters and clicking on the New Parameter button. Enter Region for the Parameter Name (In Workbook) field and select Multi-select for the Parameter Type field. Add the various regions under Options, and fill in the rest of the fields as needed. Don’t forget to click the Create button.

Portals for Tableau Multi-Select Filtering

Step 5: Open and Multi-Select!

Open your embedded workbook from your portal and multi-select away!

Final Multi-Select Parameters in Tableau

If you don’t have your own Portal for Tableau, fret not. We’ve created a standalone HTML page to demonstrate how to build a multi-select parameter control on your own system.

The post 5 Steps to Enabling a Multi-Select Parameter Control in Tableau appeared first on InterWorks.

Check Yourself Before You Wreck Yourself: Tulsa Collision Hotspots

$
0
0
Tulsa Collisions in Tableau

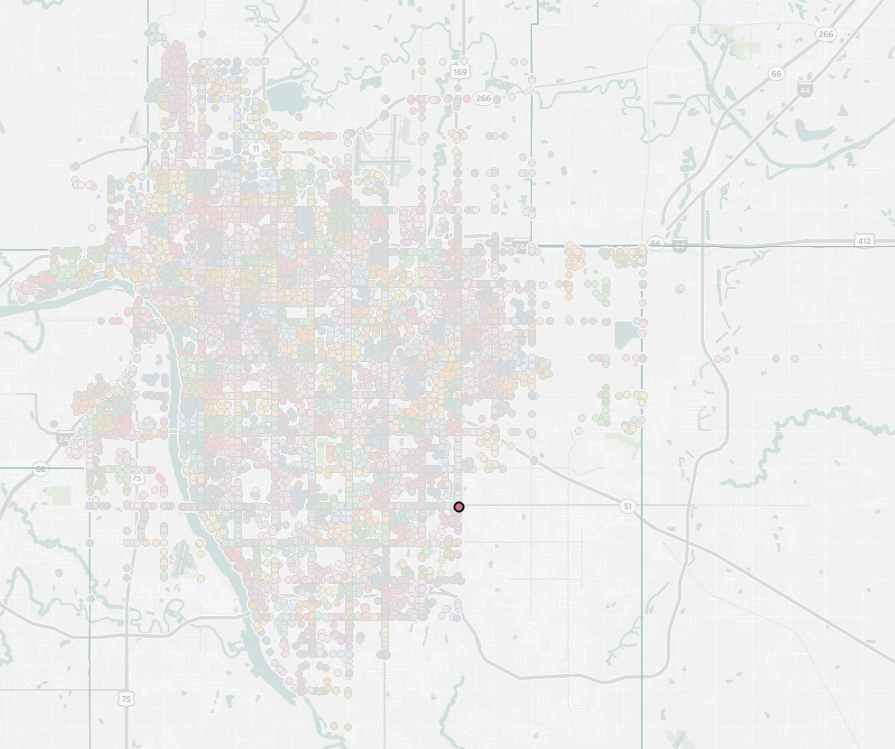
You’re a young adult in Tulsa in 2007 and you’ve got a date at a hip, new froyo place. You think to yourself (because you won’t listen to Mom), “Oh, that construction on 71st is so lame. I’m going to avoid it by speeding down 81st to Garnett and cutting through the Walgreens parking lot so I don’t get stuck at that long red light and end up being late.”

You’ve got this. You run this town. You speed down Garnett and cut through the parking lot, just like you planned, but you get too cocky and pulled out right in front of the lifted pickup truck that actually had a green light heading east. And now you’re here. In my dataset of Tulsa Police Department collision reports, visualized with Tableau Software.

Tulsa Collisions in Tableau

The Data

The City of Tulsa started the “Open Tulsa” initiative in 2013 to provide data for citizens and show more transparency as a government. In tandem with this is the concept of Urban Data Pioneers, who are community members who want to aid the local government in identifying problems and analyzing the data to aid in the policy process. So, it was in this spirit that I developed this Tableau visualization.

A Quick Method Tip

Now that we have this dataset, what should we look at? Maybe we are interested in weekly traffic trends: When do people go from the ‘burbs to their work. TPD has given us the time of the incident in the report! So, we can see in a simple highlight table that distributes collision times across days of the week and hours of the day, like so:

Highlight Table in Tableau

What does this tell us? We should stop going to work because it just leads to traffic collisions … just kidding, kind of. We do see that the majority of accidents take place during everyone’s rush to make it home to their beautiful Coors Light, I mean, wife.

The Dashboard

We can also use this highlight table to filter other visualizations on our dashboard as well. If we want to see how the geographical distribution of accidents changes during rush hour, we can select a block of our highlight table and see the data points on our map change in size and congregate a little more around the highways of the city. If we want to see how collision numbers from Friday and Saturday nights have changed over the timespan of our dataset, we can select a few boxes in the bottom-right corner of the highlight table and turn our eyes to the yearly trends tile; it looks like these late-night incidents have seen a drop in recent years!

Another point of interest is in the averages listed below our weather icons in the top-left corner. You may notice that the average normal day actually sees more collisions than a day with poor driving conditions. This seems really counterintuitive and threw me for a loop when I first saw it. Then I got thinking about my own experiences and the time I may or may not have hit some ice on a highway interchange and rubbed up against a barrier. The damage was cosmetic, so I just went on my way without the need to file a police report, the piece of paper that gets you into my dataset here. In fact, Tulsa Police Department derived a longstanding policy from the same logic called Operation Slick Streets, where they will only respond only to injury accidents on poor weather days. The thought behind this being that they will send their people where they are needed most on these days.

Let’s move on and check out our different “Collision Sites,” notated by the different colors. These were clustered together on the basis of size – relating to the number of collisions in a given area – using Tableau’s native clustering in the Analytics pane.

If we click on the dark blue for Top Collision Sites, we can see those four blocks highlighted on our map, their bar highlighted in the bar chart and the highlight table showing us a temporal distribution of collision activity. Did you notice the widening of the distribution on the highlight table when we made this selection? That’s because those locations are mainly shopping and leisure areas, meaning that people are more likely to go there outside of work hours compared to the average location in Tulsa. If we try the same method with Low Collision Sites, we see a similar pattern; these are likely residential areas.

Another point of interest is our ability to hone in on the main arteries of the city!

I remember reading an Artemis Fowl book back in my middle school glory days and the team of central characters were trying to hunt down a “perfectly” invisible aircraft. It was undetectable by any sort of radar, sonar, you name it. So, the genius protagonist’s solution was not to look for where it was, but where it was not. We can try to visualize the city’s main routes by selecting those locations with the most collisions, but a better way here is to select the lowest collision sites and see where these high-traffic and high-collision areas are not. What do you know? The main highways heading towards downtown appear to slice through the data points like a hot knife through a pad of butter.

Sometimes, where data is not is just as informative as where it is.

The post Check Yourself Before You Wreck Yourself: Tulsa Collision Hotspots appeared first on InterWorks.

The Internet Will Eat Me: Part 2 – I Still Have a Myspace

$
0
0

This is the second part in a two-part series on securing your personal data on the web.

In part one, I discussed securing your email, web browser and search engine with a variety of tools and techniques that will begin blocking unwanted collection of your personal data. In part two, I take on the beast of social media.

I started by deleting my MySpace account. Actually, I was surprised that I still had a MySpace account, but a quick guess of my email and reset of password proved I was still firmly profiled in the world of 2006. When deleting my account on the long-past-it’s-prime social site, it demands a reason for the termination. I did not even flinch before clicking “I am worried about my privacy.” Thanks for not making me lie, MySpace. Best thing you ever did.

While I would love to continue the trend of deleting accounts, I still use Facebook (albeit, very rarely), Twitter and Instagram. These sites would require a much more extensive course of security scrutiny to allow me to sleep in peace.

Facebook

With GDPR and the recent testimony of Mark Zuckerburg on Capitol Hill, changes have been made to the security features of the sites making it somewhat easier to control what is shared. Clicking on the security settings in Facebook, I enabled 2FA and reset my password. It is a good idea to examine the “Where you are logged in” section and make sure you are aware of every device listed. I was a little scared to see an iPhone 6 logged into Facebook from Mexico City, Mexico. It only later occurred to me that my VPN, another security item I will not be addressing in the post, was probably routing traffic to a server there. Nonetheless, I logged out of anything I did not need or know and moved onto the Privacy section.

Facebook Login Location

I changed the settings on each item to limit the people who could see my posts from Public to either just My Friends or Only Me. I also disabled the setting that allows search engines outside of Facebook to link to my profile.

I worked my way through each section of the Facebook settings, disabling, tweaking and erasing items that I felt violated my digital halo. I turned off the ad tracking as much as I was able. This is how Facebook makes money. They will never NOT advertise to you. My hope is that some of these settings will limit how much is collected from other sites and activities.

The section that took me the most time to adjust was the Apps and Websites section. This section lists any apps that you have used Facebook Single Sign On to log into in the past. While this feature is handy, I mean I am already logged into Facebook, it is only fuel thrown onto the fire. Here is the key, however: You cannot just simply unauthorize each of these apps. You need to contact each of the companies and have the account transferred to a standard account. Most of the time I was able to just do a password reset using the email address associated with my Facebook account and it would allow me to set a new password. I then unauthorized the app in the Facebook settings and moved on. One could spend a day on Facebook settings alone. I did, trust me.

Instagram

Instagram, while owned by Facebook, was much more concise in their settings. I enabled 2FA, per usual, and revoked the two apps I had authorized to use Instagram login, apparently years ago. I tuned my email and SMS subscriptions.

You may wish to make your account private. This requires you to authorize any followers and blocks your photos from view by people other than your followers. Of the three sites, Instagram was the easiest to adjust.

Twitter

Moving on to Twitter, I WANTED to turn on 2FA, but each time I clicked on the Start page, nothing happened. Tried in a different browser, nothing. Tried from my phone, still not working. I will come back to that I suppose.

Nothing Happened

Under Privacy and Safety, you can go nuts! There is so much to adjust. Protect your tweets, turn off location on your tweets (and delete location information from your old tweets), adjust your discoverability on the internet and disable content personalization if you wish.

I chose to disable my personalization and data settings to limit how Twitter personalizes content to me by collecting my reading and following trends. Again, this will not stop Twitter from advertising to me, but it will limit what Twitter can collect. It will undoubtedly make the ads served to me less personal, but I honestly try REALLY hard to never click on an ad or fall for a promoted tweet. If it makes it easier for me to do that by delivering me less-relevant promotions, I welcome the change.

Twitter Personalization and Data

The next thing I did was to remove all the contacts from my Twitter account that had been imported from my phone (Find Friends setting). I decided that I did not want to pull this information into my social world, as inevitably my contact’s data will be collected and exploited by these social media giants. I did not feel it was fair of me to put their data out there, essentially without their consent.

Manage Your Contacts

Once again I culled the list of apps that were authorized to log in with my Twitter credentials. One thing to note here: If you have an app that compiles your social sites such as Flipboard, revoking access will kill this. Keep that in mind when editing your list. Unfortunately, much like the 2FA, trouble arose while trying to revoke app access.

Error Message

This time, a (very temporary) switch to Internet Explorer allowed the change to occur. Maybe it was a setting switch from my previous blog that caused the error, nonetheless the app accesses were revoked.

The final thing I did on Twitter was to examine the section labeled “Your Twitter Data.” Here you can review and edit the entire history of your Twitter existence. Many of the headings relate to areas visited earlier in the cleanup process, but there you can see even more data that Twitter has collected and assumed about you based on your compiled virtual profile. If you think about this too long, you will undoubtedly freak.

This mission could continue indefinitely. Twitter, Facebook and Instagram are obviously not the only social media sites out there, not to mention the thousands of long-forgotten web presences you and I have established over the short existence of the internet. What about mobile devices or the IoT (Internet of things)? It is unfathomable to even assume you could erase yourself from the web, but a little diligence and precaution going forward could grant a dash of personal preservation.

The post The Internet Will Eat Me: Part 2 – I Still Have a Myspace appeared first on InterWorks.

PYD62 – Machine Learning With Patrick Masi-Phelps

$
0
0

THE ROBOTS ARE TAKING OVER! Okay, that’s not entirely accurate…yet.

Dataiku’s Patrick Masi-Phelps goes behind the scenes with our own Robert Rouse to see where machine learning is developing and where companies are using utilizing it and artificial intelligence to make better decisions for their business. The future is now!

Subscribe to Podcast Your Data through iTunesStitcherPocket Casts or your favorite podcasting app.

The post PYD62 – Machine Learning With Patrick Masi-Phelps appeared first on InterWorks.

Creating a Dual-Axis Map in Tableau Using Polygons

$
0
0

Note: If you are just looking for the TL;DR quick solution to mapping two spatial files of two different granularities, scroll to the very bottom.

I recently moved to New Orleans, and with a background in public policy, I soon dove head first into understanding some of the community dynamics. One of the first books I picked up, “Bourbon Street: A History,” had a page detailing all of his sources, and as I began combing them through, I found some fascinating data.

One item that particularly caught my eye was from a project called “Mapping Inequality” that looked at redlining in New Orleans. In the 40s and 50s, many people of color, specifically those of African-American heritage, were denied financing on homes. This map details exactly where banks refused to give loans.

I found this map fascinating and thought it would be interesting to overlay it on a census map to see if I could track if the census blocks that were redlined still experience high rates of poverty or had specific characteristics.

Shapefiles and Tableau

To do this, I downloaded shapefiles from the U.S. Census Tiger files and started my work in Tableau. I was really excited to use shapefiles because Tableau recently introduced shapefiles.

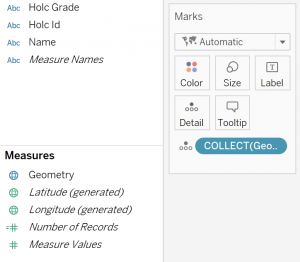
When you load a shapefile into Tableau, you get a new field under your measures called Geometry. When you bring that Geometry to Detail, Tableau aggregates it into a single mark using the COLLECT aggregation:

COLLECT Aggregation in Tableau

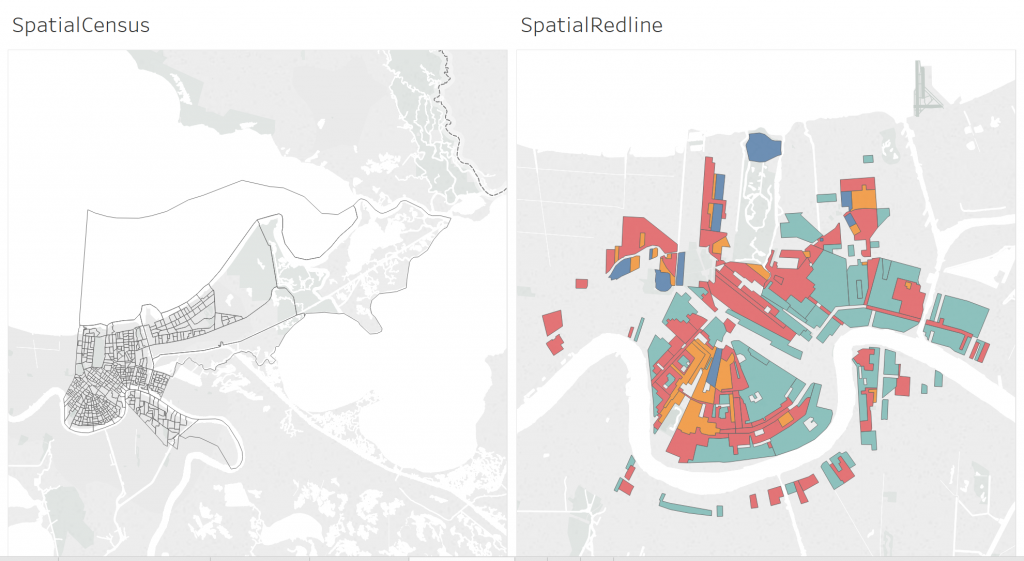
At first, I brought in each spatial file separately and had them next to each other on a dashboard, as shown below:

Separate Spatial Files in Tableau

The problem here is that it was difficult to see exactly which districts were in which census blocks; I needed to make a dual-axis map.

For those of you who have worked with dual-axis maps in Tableau before, you know there is one golden rule:

You can only use one latitude and longitude.

Unioning the Data in Alteryx

Having two data sets, I went to work on “unioning” these two shapefiles together. I put “unioning” in quotes because when I teach Tableau, I emphasize unioning is for data that is structured the same, and that’s clearly not the case. The only reason I’m doing it is to get a shared Lat/Long field.

In Alteryx, I imported both shapefiles, unioned them so they shared a latitude and longitude, filtered by census data to only include Orleans Parish and then exported this as a new shapefile.

Loading the New Dataset into Tableau

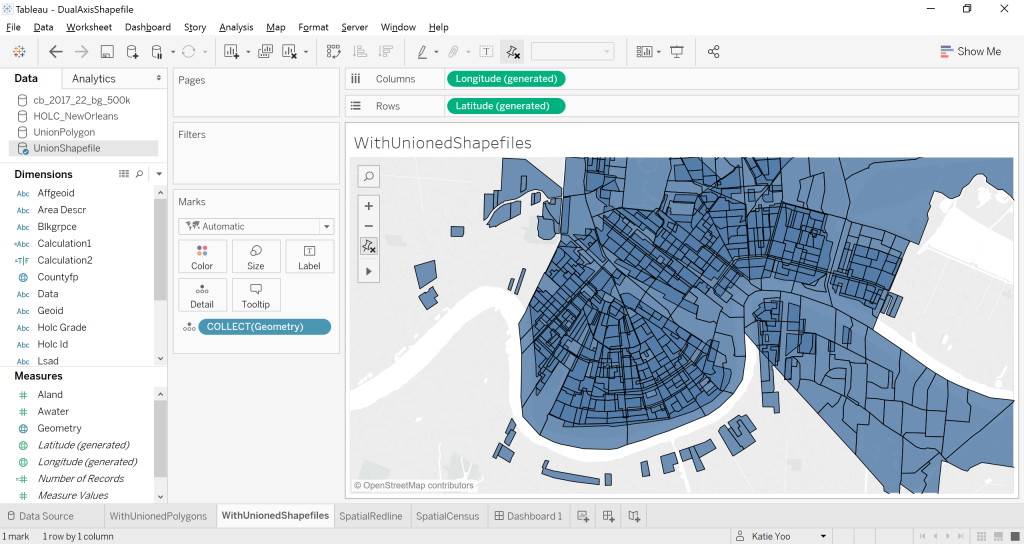
I loaded that new dataset in, and again, I had that Geometry field in my measures. Once I brought that field to Detail and Tableau aggregated it using the COLLECT() aggregation, all of my data was interestingly treated as a single mark:

Data Treated as a Single Mark

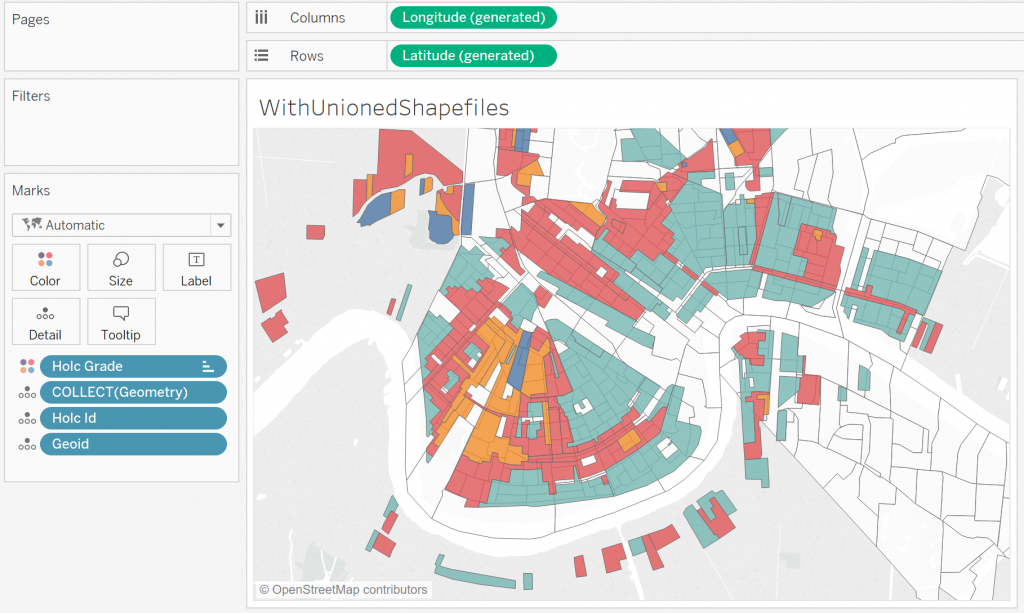
Tableau highlights this single mark when explaining shapefiles, and to change this, similar to maps with non-spatial files, the user must bring an additional level of detail to the view to break it up into separate marks. Since I had two levels of detail I wanted to display, I brought in both of my map levels of detail (Holc ID and GeoID) and was able to see both layers of my data:

Both Map LoD

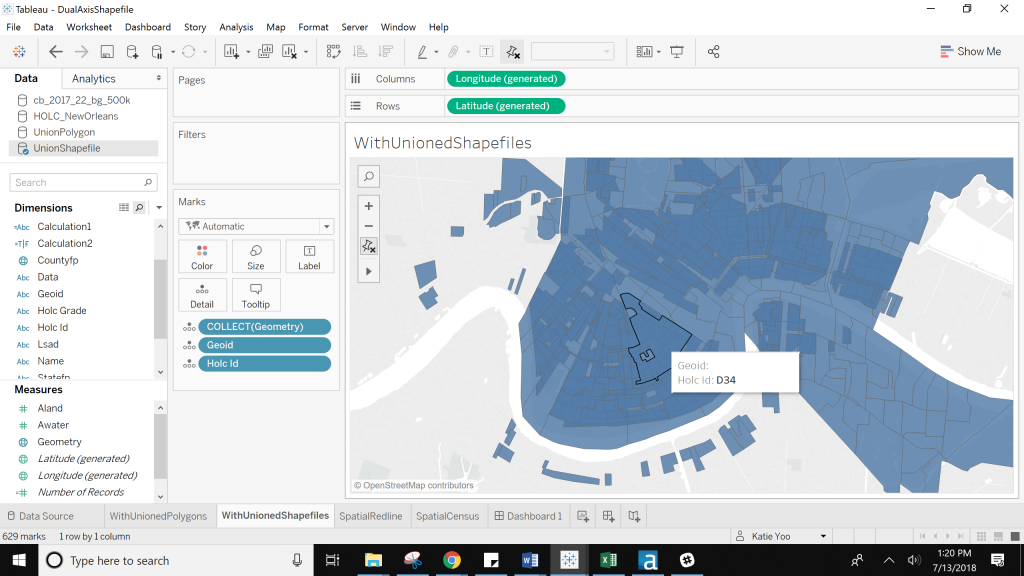
My problem here is that I still only have one Marks card … and one Marks card means the same formatting for both data layers. Since my goal here is to see how census blocks overlay the redlining districts, I want to see the census blocks as the “top” layer. Since Geometry just displays everything, I can only hover over census block groups if they aren’t behind a redlining zone:

Layering Problems

(Notice that I can’t see the census blocks (at the level of detail of GeoID) because this redlining district (Holc ID D34) covers them up.

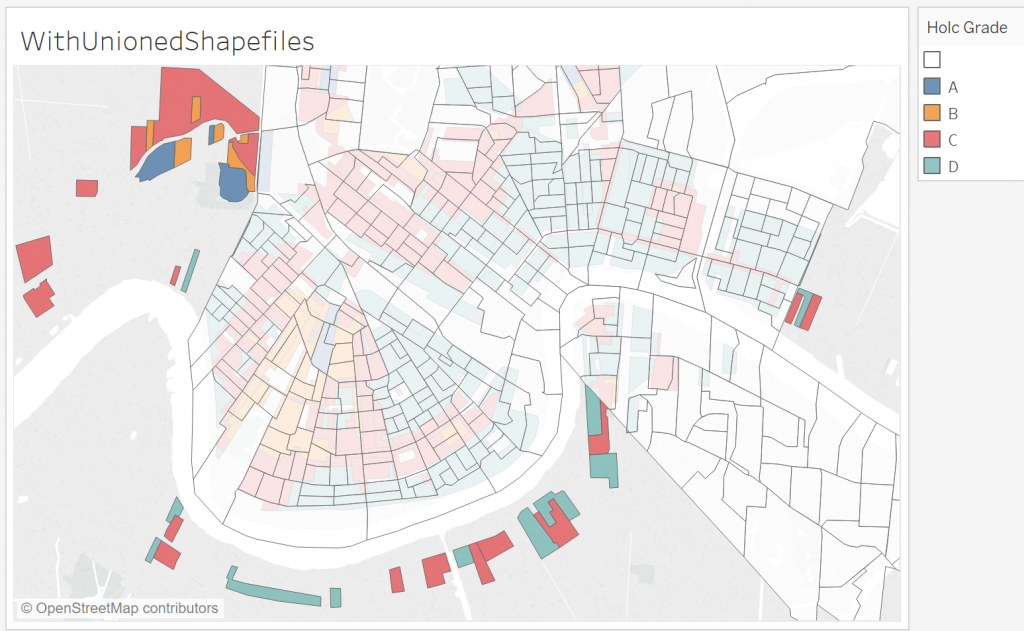
I could switch the order to see census blocks on top and try to color by the redlining districts, but because all of the census blocks are Null in the redline district column, they have to be colored as well. I try to dummy code them as white, but it’s still hard to see the overlap:

Difficult to See Overlap

Transforming Shapefiles into Polygons with Alteryx

While that new Geometry field for spatial fields is really handy, given these limitations, I went back to my pre-spatial file mentality and using polygon files. As Chris Sanders has written about before, there’s an Alteryx Analytic App that can transform shapefiles into polygons.

I plugged both my zipped shapefiles into the app and download a CSV of them. I then brought those into Alteryx and ran my workflow again (still unioning on latitude and longitude). I also made a Data field so I can easily check which data source a row was coming from.

Alteryx App

Bringing the Polygons into Tableau

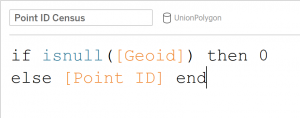
Now that I had my data as a CSV that I could use for a polygon map, I brought it back into Tableau. Each data set had a different set of points and paths, so I first calculated different paths for each one:

Point ID Census Calc

Point ID Redline Calc

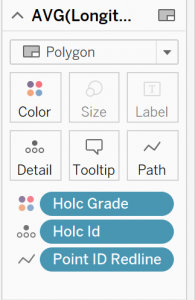
Having changed my Mark type to Polygon, I brought the Avg(Lat) and Avg(Long) to Rows and Columns. On the first Marks card, I looked at the redlining data; I brought the ID to Detail, my Point ID Redline calculation to Path, and then its classification to Color:

Dragging Calcs in Tableau

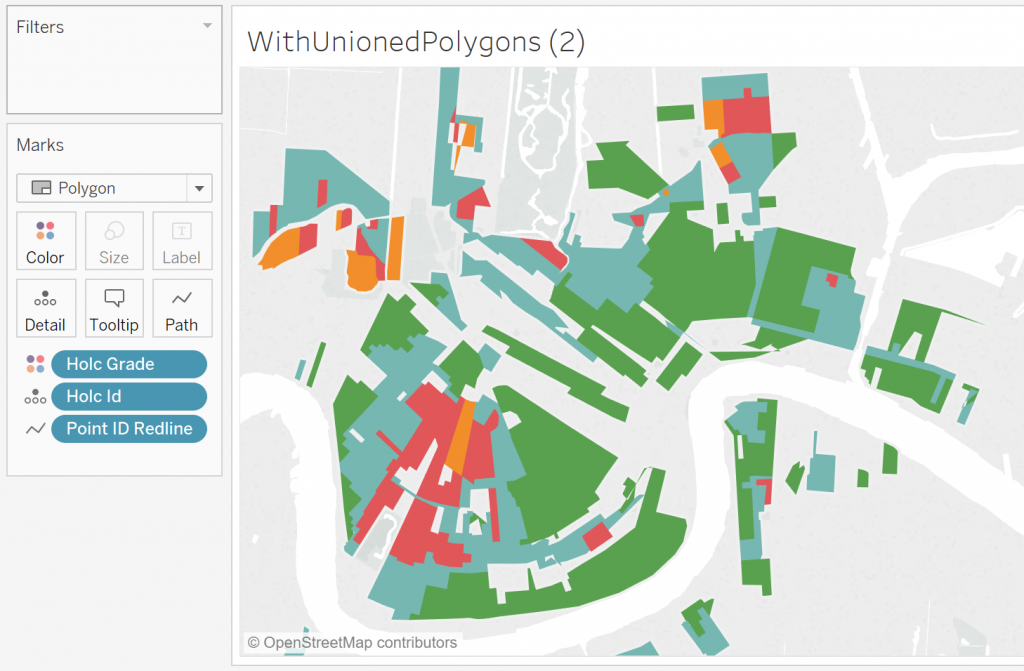
I knew I was on the right track because even with this new unioned data source, I was only seeing data from my redlining data; essentially by using that Point ID calculation instead of Geometry, I was able to only see part of my data:

Part of the Data

I duplicated my Avg(Longitude) and made a dual axis. On the second Marks card, I brought the census block ID to Detail, my Point ID Redline calculation to Path and then added a border.

Now, I could see both datasets, formatted differently, yet still on the same sheet:

The Takeaway

If you have two different spatial files that you would like to map in Tableau, that Geometry measure will work across the entire data source. This will work well for datasources that are at the same granularity. However, if you need a dual axis for two different granularities or layers of your data, I recommend converting those shapefiles to polygon files and changing what is on detail and how the path is calculated.

The post Creating a Dual-Axis Map in Tableau Using Polygons appeared first on InterWorks.

Viewing all 2695 articles
Browse latest View live