Quantcast
Channel: InterWorks
Viewing all 2695 articles
Browse latest View live

Portals for Tableau New Feature Spotlight: Project Workbook Links

$
0
0
Portals for Tableau Creating Nav

Portals for Tableau make it easy to publish only the relevant dashboards to your users. However, let’s say you have a project folder on your Tableau Server that all of your users should have access to. Let’s also say you want your portal’s navigation laid out in a workbook > dashboard structure. Lastly, let’s say that you want any new dashboards that are published to this project to show up in the navigation immediately, and any dashboards you take down to disappear from the navigation immediately.

If you were reading that and thought to yourself, “Hey, self, I think that’s exactly what I need. They must be talking to me.” You’re right. We added just such an option for you.

To create navigation like this, select the Workbooks type when adding a new menu item (Backend > Content > Nav Menu > New Menu Link). You’ll be able to select the site and project from Tableau Server and give it a fancy title.

Portals for Tableau Creating Nav

Once you save, you can drag it to your menu as needed. However, if you’re using top navigation, you’ll need this new workbooks menu item to be at the top level. Since the nature of this menu type has three levels by default and top navigation can only show three levels, if you put it any lower, you won’t be able to see the dashboards, and what fun is that?! Side navigation does not have this limitation, though.

Portals for Tableau - Link Workbooks

The post Portals for Tableau New Feature Spotlight: Project Workbook Links appeared first on InterWorks.


Picking a Summer Vacation Spot on a College-Kid Budget

$
0
0

Around mid-April, I got the idea to get out of town for a few days to regroup after a long semester filled with accounting and MIS courses. I recently moved into the Data Engineering Intern role here at InterWorks, and I wanted to be ready to dedicate my full energy to the role. I thought the best way to do that was to spend some time to clear my mind and fully reset. As a college kid and millennial, I naturally love to do things I can’t afford, so I decided to plan a three-day vacation for as cheap as possible. To help me plan, I decided to dig into the data behind traveling to a handful of locations. Using Tableau, I was able to create a data visualization of my findings. Check out the dashboard below, then read on to see how it all came together:

Data

To pick out what locations to analyze, I looked at a few cities that were drivable from Stillwater, Oklahoma. This lead me initially to look at Austin, Texas, Nashville, Tennessee, New Orleans, Louisiana, Chicago, Illinois, and Denver, Colorado. From this list, I narrowed it down to Austin, Nashville and Denver to build a dashboard around. After figuring out what cities I wanted to learn more about, I discovered insideairbnb.com. The site specializes in obtaining raw data from Airbnb for further analysis. Their site contains quite a few visualizations itself but also allows you to download the text files from http://insideairbnb.com/get-the-data.html. I opted to download data for each of my destinations from 2007-2017.

Analysis

After pulling the three CSV Files into an Excel workbook as individual sheets, I created a “Master Sheet” containing the city names to create a join within Tableau. Since the data relating to the cities all shared similar attribute names, I performed a union in Tableau to clean it up and make it usable. After the data was pulled into Tableau, I started understanding more about what kind of rental I could get in each city.

Being from Texas, I had pretty much anticipated going to Austin for the nine-millionth time. All jokes aside, I’ve visited Austin probably ten times and based on the small budget I was working with, I was unsure if Denver or Nashville would be realistically attainable. After looking at the data, the situation ended up being completely reversed. Austin is, on average, $20-40 a night ($60-$120 over the course of my trip) more expensive than Nashville or Denver. That adds up quickly, especially considering I would be eating a majority of my meals away from the Airbnb.

After doing some more digging, I found out that during the month of May an Airbnb in Denver is practically the cheapest it will be for the entire year. Considering I started work on May 21 and only had availability to leave town from May 14-16, this met my needs perfectly. In addition to this, displayed in my donut chart, Denver has the highest quantity of available listings during this time frame. After inputting my trip dates and selecting Denver on my Pick a City and Book! URL dashboard action, I had found a rental in under 30 minutes.

Trip

The trip was awesome! The driving distance to Denver was about 650 miles, and it took nine hours to get there.  If I had chosen to go to Austin, it would have cost me roughly $60 more than Denver and the driving distance was about the same. Having that extra cash made the trip so much more enjoyable. I went to look at Red Rocks Amphitheatre and spent most of my time in the LoHi neighborhood enjoying the weather and planning out how to get the most out of this summer as a Data Engineering Intern. Here are a few pictures from the trip:

  • Holt Mountain Top

Some Final Thoughts

By far the best part of this entire experience was getting input and feedback from the rest of the team at InterWorks. From my initial layout of this dashboard, I was able to exponentially enhance its functionality due to ideas from people like Russ Lyman, Derrick Austin, Sidd Suresh, Will Jones and Katie Wagner.

From raw data to dashboard, there was an expert available every step of the way (there was even a situation in which Eli Sprague had to help recover the dashboard from a dead hard drive for me) to bring this to completion. Whether it’s IT or analytics, there is always an internal expert who is available and willing to help, which is invaluable for an intern coming in. I also believe that’s the reason InterWorks continues to provide value to our clients.

Keep up with me and my work on the blog this summer. I would also love to connect with any of you on LinkedIn (here). If you have not had the opportunity to visit Denver, I highly recommend it. Plug in your dates on the dashboard and pick out your place!

The post Picking a Summer Vacation Spot on a College-Kid Budget appeared first on InterWorks.

Portals for Tableau 101: URL Actions

$
0
0
Portals for Tableau - Add Origin Dashboard

URL actions are powerful and useful things to have in your Tableau dashboards. Many use these actions to navigate from one dashboard to another. Portals for Tableau supports URL actions, but we suggest a few adjustments for the best results. This guide will help you to make these changes and optimize your URL actions for use in Portals for Tableau.

Step 1: Origin Dashboard

To start, add your origin dashboard to the portal. For a deeper dive on this subject, please check out my earlier blog post: Portals for Tableau 101: Dashboard Creation. After you have added your dashboard, click on the Advanced tab.

Portals for Tableau - Add Origin Dashboard

Now, scroll down to the Embedded Options section so that we can set a new Link Target. The Link Target drop-down controls the Tableau dashboard’s link behavior. For your origin dashboard, set this to Parent. This will allow your users to navigate in the current tab to the new destination dashboard.

Portals for Tableau - Embedded Options

Step 2: Destination Dashboard

This is where we will create the destination dashboard. This will be set up similar to the origin dashboard in the previous step. You will want to change the new destination dashboard’s Link Target to be Parent as well. This will allow the destination dashboard to navigate if we have more URL actions.

If you want this destination dashboard to be only accessible through a direct link, like a URL action, then we will need to set the dashboard to be Hidden. To toggle this on you will need to click on the Misc tab.

Portal for Tableau - Misc. Tab

Scroll down to the Look/Feel section for the Hidden switch and toggle that to ON.

Portals for Tableau - Loading Screens

Repeat Step 2 for each different destination dashboard.

Step 3: Tableau Workbook Updates

Now, open your workbooks in Tableau Desktop. In Tableau Desktop you will want to edit the URL actions to link to the dashboards you created in the portal in Step 2. This is to replace the reference to the Tableau Server so the user always stays in the portal.

Add URL Action

Since we are passing data values over the URL, check the box to URL encode data:

You can pass filters and parameters through the URL, just as you would on Tableau Server. For more on doing this, view Tableau’s post on the subject.

Once you have completed these steps, you will have optimized dashboard URL actions with Portals for Tableau. These steps will keep the user experience within your portal while still providing them the power of URL actions.

The post Portals for Tableau 101: URL Actions appeared first on InterWorks.

Viz for Social Good: Dear Tech People

$
0
0

It should be no secret by now that diverse teams solve problems more effectively and are simply a good thing to have as we work toward building a more inclusive world. But how are top tech companies doing at building diverse teams? Dear Tech People has enabled responses to this question by scraping data from sources such as LinkedIn for 100 top tech companies and partnering with Viz for Social Good to make the data publicly available.

A detailed description of the Dear Tech People methodology is available on their website, but the high-level overview is that diversity attributes, such as race and gender, were determined programmatically using name analysis and facial recognition, as well as manually with humans identifying employee profiles. Job roles were categorized based on job titles. While the methodology can certainly be improved, this is an amazing first effort to make this type of data so widely available.

Tableau Dashboard Design

With the data ready to go, the next step was to build a dashboard in Tableau (which you can find at the bottom of this post). My colleague Brenden Goetz deserves a big shoutout here for his invaluable insight throughout the whole process. The goal of the dashboard is to provide context to compare race and gender representation within companies across different sectors, as well as provide context for how those companies compare to others within their same sector. Most importantly, we wanted users to be able to take action, so we provided a few options at the bottom. These are only a few of many possible ways to improve inclusion and diversity within your organization, so let us know if you have more ideas. Just post in the comments sections below.

In terms of the design itself, we wanted to mimic trends in website design, such as creating distinct sections that you can digest in chunks as you scroll down the page. We found inspiration from the design community on dribbble.com and decided to use color blocks that stretch across the page to offset sections of explanatory text. The people image icon was downloaded from dreamstime.com and guided the color palette for the rest of the dashboard.

We also used font size and weight to create a clear visual hierarchy of text. Large Courier New fonts ensure that headers are obvious at first glance, while longer sections of paragraph text are shown in a smaller gray Century Gothic. The gray font de-emphasizes the longer text blocks in case viewers don’t have time to read it all, while the black fonts showcase critical information and make the dashboard easily skimmable. The dashboard title is a custom font from 1001freefonts.com and uploaded as an image so it would render correctly on all browsers.

Now go explore!

The post Viz for Social Good: Dear Tech People appeared first on InterWorks.

 X Marks the Spot: How to Map Just About Anything with Tableau

$
0
0

When it comes to Tableau, I have something of a soft spot for the mapping functionality in all its glorious forms. Maybe I was a pirate with treasure to hide in a previous life, or maybe some intrepid explorer. Either way, I seem to delight in finding new and interesting ways to plant an X on a map.

Recently, I had a client ask me rather sheepishly if it was possible to put an X on a fictional map. I just smiled and said “absolutely.” I’ll save them their blushes and instead share how I paid homage to world famous artist Paul Middlewick (no relation) when I recreated his “Animals in the Underground” art to demonstrate just exactly how this is done.

First, Acquire Your Map

First and foremost, you’ll need your fictional map. It could be a something like Tolkien’s map of Middle Earth, or it could be something a little more grounded like a building or site schematic. I’m using the London Underground map, and I’ve chosen to de-emphasise the various colours and present this as a simple greyscale representation. I also sourced a map minus any text labels. This allows me to superimpose my homage without any background clutter.

Before we start plotting anything on the map, we should work out what proportion of your finished dashboard the map will represent, since you’ll be overlaying points or polygons using the X and Y pixel locations on your map.  The easiest way to do this is to set up your dashboard layout, placing an image component onto your dashboard canvas that shows the map at exact size. If the map is too big or small for the area you have allocated, then use an art program like Microsoft Paint or even PowerPoint to resize your image to the appropriate size. Make a note of the height and width of your image in pixels, as you’ll need this later.

Using Drawing Tool for Tableau

Next, you’ll need to visit InterWorks’ Drawing Tool for Tableau – a free little tool we have for exactly this purpose. You can drag and drop your image from Windows File Explorer onto the Drawing Tool. Then, you need to choose whether you want to overlay polygons, lines or dots onto your map.

This video outlines how to use the Drawing Tool: Drawing Polygons with PowerTools Drawing Tool.

Regardless of whether you’re mapping points, lines or polygons, what you’ll end up with is point data that can be copied in CSV or table format and established as a data source.

Drawing Tool for Tableau

Above: As you draw your map shapes, the point data is added. Copy this out as either a CSV or Excel table to start using it as a data source in Tableau.

Bringing the Data into Tableau

I always choose to copy this data out as a table and paste it into Microsoft Excel. This enables me to enhance the data with additional columns. It is then ready to use with Tableau directly or with an ETL tool to load into my data repository. In my case, I’ve created two separate Excel tabs: one containing the line data for the shape of each animal and another containing point data for the location of their eyes. This is then joined in Tableau.

Point Data in Excel

We then need to tell Tableau that we’re including a background image on our map. Go to the Maps menu and select Background Images. You’ll be presented with this screen:

Tableau - Maps - Background Images

  • Click the Add Image button and browse and select your image
  • Select the data field with the X coordinate location
  • Repeat for the field with the Y coordinate location
  • Enter the right and top pixel counts of your image, so if you have an image that is 1200 wide by 1000 pixels tall, your setup would look like this:

Tableau Background Image

Now that Tableau knows there is a background image, lets present it and overlay our data:

  • Add your X coordinate data field to the Columns shelf
  • Add your Y coordinate data field to the Rows shelf
  • Add your PointID and ShapeNo fields to the Details shelf
  • Edit both your X and Y axis and use the fixed scale option to ensure the entire image is always shown, like this:

Tableau - Edit Axis

Change your marks type to Line if drawing lines, or polygon if drawing polygons, and your shape should appear on the image:

Change mark types

Above: In this image, I also have a filter on shape, as my data source includes the outlines for multiple shapes.

Adding the eyes in my viz or other mapping data in your own viz can be accomplished by using a dual-axis map.

  • I added the additional X and Y dimensions from my Eyes datasource to the Rows and Columns shelves
  • I made the chart dual axis by clicking on the new pills and selecting Dual Axis from the menu
  • I synchronised the secondary X and Y axes
  • Because my second set of data is point data, I changed the mark type to Circle
  • Hide your X and Y axes and “voila!”

Final Map in Tableau

Below is the final Tableau visualisation. Please feel free to download this workbook for a look at how it was put together. If you like what you see, then please visit the Animals in the Underground and support Paul’s & Co’s work.

If you have any questions or mapping scenarios, I’d love to hear from you. Take a look at my Tableau Public gallery and www.interworks.com\viz-gallery for other great examples.

The post  X Marks the Spot: How to Map Just About Anything with Tableau appeared first on InterWorks.

Portals for Tableau New Feature Spotlight: User Commenting

$
0
0
Portals for Tableau - User Comment Example

Some people like to post their work on the internet with no regard as to what people think, whereas other people are social and actually would like general feedback and questions from their audience. Portals for Tableau has added a feature for the latter group. Actually, it can be used by any portal user, but the former group won’t care, so let’s ignore them for now.

Say Hello to User Commenting

User commenting functionality has been added to the Portals for Tableau Data Manager feature. It provides the option to allow comments on individual dashboards, pages and mixed content pages. Once enabled, any user can post a comment and read the comments posted by others. These comments could contain questions about certain anomalies seen in the data, suggestions on how to improve the viz or an ongoing dialog to drive understanding and insight. As a bonus, if your grandmother is a member of your portal, this could also be a great tool for learning all about the nice young waiter she had while eating a bowl of soup at the diner for lunch that day.

To enable commenting, first make sure the Data Manager feature is turned on by navigating to Backend > Settings > Portal Settings > Features.

Portals for Tableau - Data Manager Feature

Next, navigate to the desired dashboard, page or mixed content page (Backend > Content), toggle on the Allow User Commenting option, and save. For dashboards, this option can be found under the Misc tab.

Portals for Tableau - Allow User Commenting?

After turning on user commenting, users will now see comments at the bottom of the page and a form to submit new ones.

Portals for Tableau - User Comment Example

If someone makes a typo in their comment or accidentally pastes an email they were drafting and didn’t catch it in time before pushing the Post button, they also have the ability to edit their comments just by clicking on them.

Portals for Tableau - Enter User Comment

The post Portals for Tableau New Feature Spotlight: User Commenting appeared first on InterWorks.

See You in London for Tableau Conference Europe 2018

$
0
0

Tableau Conference Europe 2018 is on the horizon, and it is at this time of year that the buzz starts kicking off. The planning and preparations are in full swing, and we cannot wait to see all of the goodies that Tableau has in store for us 3-5 July in London.

So much has happened for Tableau in the last 12 months with a new version release in 2018.1, Tableau Prep and now a new way to purchase Tableau.

InterWorks is proud to be sponsoring #TC18Europe, and we have some great content to share with you at the conference. We are super excited to demo with you what we have been doing to support you in your quest for embedded analytics through our Portals for Tableau. Portals from InterWorks are designed to power-up your Tableau environment and to ensure your hard-working dashboards don’t vanish into obscurity.

Power Tools for Tableau

TC is the perfect place to come and see our suite of Power Tools for Tableau, there is something for everyone whatever stage of your Tableau journey.

Power Tools for Tableau Demo

Above: A Power Tools for Tableau demo at a previous concert.

Power Tools: Desktop – It’s the Swiss Army Knife of Power Tools! With Power Tool: Deployment, you can rest assured your Tableau workbooks have the highest level of consistency in design and performance.

Power Tools: Server – You can now sift through all the noise and target exactly what is causing slow load times, extract failures and other critical server issues.

Power Tools: Deployment – When you use Tableau in the enterprise, you get a lot workbooks, and we mean A LOT. You also get different environments in which those workbooks reside. Moving all those workbooks around can be a hassle. Power Tools: Deployment makes that process a piece of cake. With it, you can promote workbooks from one environment to another in a matter of minutes!

Take time out to come and speak to us about our Power Tools for Tableau and how they can help your organization!

Stronger Together

We’ve had a close eye on what is happening in the marketplace over the last 18 months, and we know that you are looking for the complete solution. That is why we are working with some of the best partners out there. Come and talk to us about Snowflake, Exasol and Alteryx and all of the great work we have been doing for our customers.

Iron Viz

We’ve been watching the vizzes flying in, and we are seeing an incredible amount of creativity and talent. Iron Viz is one of the ultimate accolades that Tableau evangelists can have on their resume as we saw from last year’s winner, InterWorks’ own David Pires. Although David is not taking part this year, he is not shying away from the limelight and will take his place as one of the judges.

Iron Viz Europe 2017

Above: David and other Iron Viz contestants onstage last year.

See You There!

As you can see, we’re bringing all sorts of goodies to this year’s conference in London. Stop by and say hello to us at the Bar Chart, take time out for a drink or demo and see some of the great offers we have lined up for you.

The post See You in London for Tableau Conference Europe 2018 appeared first on InterWorks.

Mastering Viz in Tooltip and Tooltip Filtering in Tableau

$
0
0
Tableau Viz in Tooltip

Tableau recently introduced the viz in tooltip feature to Tableau Desktop, allowing users to add a whole new level of detail to dashboards and worksheets. For those who have been using Tableau for a while, you are already familiar with the impact a strong tooltip can have on your work. For those who are newer and unfamiliar with the power of tooltips, please check out this blog post from Brooks Barth.

Building on the functionality of the original tooltip, we can now embed entire Tableau worksheets into the tooltip, making the opportunities endless. In this post, I am going to walk you through how to set up a worksheet to use the viz in tooltip feature. In addition to this, I am going to show you how to incorporate that tooltip into the overall dashboard filtering structure, which requires a little custom maneuvering.

Use Viz In Tooltip

To embed a sheet into our tooltip, the process is integrated very well into the standard tooltip formatting window. I am going to demonstrate how to use the viz in tooltip by walking you through adding it to a small dashboard I made for this purpose called Superstore’s Quarterly Sales Update:

Superstore's Quarterly Sales Update

This dashboard shows our users the sales for our Superstore broken down over recent quarters, with the added functionality to filter the line chart by selecting a state. The information that this provides is not bad. Here’s where we make it better and play with the tooltip!

My vision for this dashboard is for the users to not just find out how they have been performing but to pull information out of this that will affect the decisions that decide how they will perform. Cue viz in tooltip:

What Value Would a Tooltip Viz Add to My Dashboard?

This may seem like a silly question, but it is always important to ask yourself this prior to adding anything – especially if the main driver is the new feature. Since I’m closer to 10 years old than 40, I love nothing more than shiny new toys. While new stuff is great, these new toys can take away from your overall design if not implemented properly.

Jeff Goldblum

To get the most out of this dashboard, I am going to provide my users with the subcategories that are driving their sales. Adding this will allow them to not only see what their sales were but what subcategories drove those sales so they can invest appropriately for the future! To avoid distraction in the tooltip, I will use a bar chart to present this information. I built this sheet named Tooltip Subcategories:

Tooltip Subcategories

How Do I Put This Sheet in My Tooltip?

Luckily, like I mentioned earlier, the actual embedding process is quite simple. To embed this sheet into our tooltip, all I have to do is navigate to the tooltip Marks card. Once in the formatting window, we have the option to insert sheets. I can then select my Tooltip Subcategories sheet:

Tooltip Subcategories - Sheets

After submitting this change, my tooltip presents my users with a bar chart outlining what subcategories made up Superstore’s sales. To follow best practices, I updated my worksheet’s title to let my users know there is more information hidden in the tooltip:

Tableau Viz in Tooltip

Filter Viz In Tooltip

The Tooltip Filter

Tableau Filters

One of the greatest features that come with viz in tooltip is the tooltip filter. The tooltip filter does a great job updating that tooltip viz’s contents. An example of this is displayed above when the tooltip sheet presents information relating to 2018 Q4. This is awesome for that initial view or if you are working with a worksheet that will not be filtered itself. Where the tooltip filter begins to fall short is when the sheet your tooltip viz lives on is included in a dashboard action.

Due to the tooltip filter only being able to communicate with information dictated by the sheet it is a member of, we can sometimes be left with a tooltip viz that references the incorrect data. Here is an example: When I filter my dashboard by selecting a state, my tooltip sheet is clearly incorrect. The sales figure for phones remains at $35k regardless of whether we’re filtered to Texas or not:

Hover over different points on the line and you will see data is still reflecting my total sales number. Luckily, we can resolve this issue with some creative filtering.

Update the Dashboard Action Filter

Our first step in making my filter apply to the tooltip viz is to edit our dashboard action filter. It is imperative that the dashboard action is targeting the sheet directly, not the sheet’s location on our dashboard:

Edit Filter Action

***Notice the Target Sheet is Sales Over Time, NOT a selection of Sales Over Time on the Quarterly Sales Update Dashboard.***

Apply the Filter to the Tooltip

Now that I have changed my dashboard action to reference my sheet directly, that filter can now be edited at the sheet level. Since my tooltip sheet must take cues from its master, this allows me to edit the filter’s settings to apply it to my tooltip. To do this I will navigate to the Sales Over Time Sheet and select the action filter. After selecting the filter, I will have the option to Apply to Worksheets. From there, I can select the sheets I want the filter to affect (here that is my Sales Over Time line chart and my Tooltip Subcategories bar chart):

Apply to Worksheets - Selected Worksheets

Apply Filter to Worksheets

BOOM – Finito

Now that I have manipulated my dashboard action to affect the tooltip, my worksheet now references the correct data and presents my user with a detailed level of information regarding their sales. Hover across the line below to find out the details:

Now that you are a master of the tooltip viz, let me know how you implement it in your dashboards! If you want to get some hands-on practice messing with the filters, download the dashboard I made below.

The post Mastering Viz in Tooltip and Tooltip Filtering in Tableau appeared first on InterWorks.


Portals for Tableau New Feature Spotlight: Data Manager CSV Download

$
0
0

If you’ve used Portals for Tableau’s Data Manager feature, it’s likely you have utilized the Tableau-friendly table in your dashboards.  However, there are times when you need to get at the raw data but don’t have or don’t really need direct access to the database. Instead of hounding your go-to IT critter to get that access, we’ve added a button to download the raw data directly from the portal.

To download the data in a Data Manager group, navigate to the specific group by going to Backend > Data Manager > Data Groups > Click on the group. Now, scroll to the bottom to find a Download as CSV button. It’s probably not obvious what will happen next, so I’ll tell you. When you click that button, a CSV document will be downloaded with the raw data from that group like magic. This file can be opened in Microsoft Excel or whatever tool you usually use for comma-separated values. The sky is your limit here.

The post Portals for Tableau New Feature Spotlight: Data Manager CSV Download appeared first on InterWorks.

PYD58 – Tableau Community With Patrick Van Der Hyde

$
0
0

If it takes a village, our village is lucky enough to have current and former Ambassadors and Zen Masters. Which is fortunate, because, in this episode, we dive into all the ways you can and should get involved in the Tableau Community. You know, if you’re into Tableau. And if you’re listening here, you’ve at least heard of Tableau.

From forums to blogs to social media, our panel is Social Media Ambassador David Pires, former Tableau Forum Ambassador Derrick Austin and former Zen Master Robert Rouse. They talk about their experiences getting started, getting help and getting ahead with support from the Tableau Community. AND if that isn’t enough, Mat Hughes sits down with Patrick Van Der Hyde, Tableau Community Support Manager, to get the inside scoop on the Community.

Subscribe to Podcast Your Data through iTunesStitcherPocket Casts or your favorite podcasting app.

The post PYD58 – Tableau Community With Patrick Van Der Hyde appeared first on InterWorks.

The InterWorld Cup: Who to Support in a World Cup Without the USA

$
0
0

As the World Cup kicked off last week, some Americans may have been surprised to notice the lack of the Stars and Bars being represented in the games. Even if you are a bit more dialed into the soccer community and were aware that the USA did not qualify, you may still be having a hard time figuring out who to support.

There’s a Quiz for That

Enter FiveThirtyEight, a fantastic data-driven journalism site covering sports in addition to politics, science, pop culture and other topics that the variety of writers deem worthy of evidence-based investigation (may I recommend their feature analyzing 1,000 fortune cookie fortunes). I’ve never gone from so apathetic about a topic to so fascinated in such a short time. It’s well worth the read, as is the Twitter bot they built to generate fake fortunes.

Anyway, they recently published a project aimed at providing us lost souls with some guidance as to which colors to wear during the tournament. It asks you what kinds of traits you like in a team – offensive or defensive; underdog or favorite; “Goal!” or “Gooooooooool!”

Comparing with InterWorks’ Selections

I wanted to compare how these suggestions aligned with teams that my colleagues at InterWorks had selected themselves. For example, I like England as its comprised of a number of players from my favorite team, Tottenham. However, FiveThirtyEight suggested I look at Sweden, as I look for a well-balanced team that is more physical and has a shot to make a decent tournament run. I wasn’t the only one who was “off” in my selection. In fact, only one InterWorker supported the team he was suggested. What I found most interesting was the disparity between the popular teams and the commonly suggested teams.

See below for a breakdown of the findings.

The Surprising Results

As you can see, I wasn’t the only one who likes the Lions – they were the most popular pick (I’m sure this has nothing to do with us having a location there). The second most popular was the selection of “I choose match by match.” However, our top two suggested teams weren’t even chosen once! According to our friends at FiveThirtyEight, we should be looking south of the border at Peru and Mexico, along with everyone’s favorite 2014 underdog, Iceland.

Thanks to FiveThirtyEight for putting together a fun way to connect with my coworkers and generate a bit more attention around this year’s tournament! The first few days have been plenty of fun and I’m sure there’s more around the corner. Now come on England – and Heja Sverige!

The post The InterWorld Cup: Who to Support in a World Cup Without the USA appeared first on InterWorks.

PYD59 – Tableau Conference Europe 2018, Part 1

$
0
0

Tableau Conference Europe 2018 is right around the corner! To prep, David Pires talks to some of his favorite (or “favourite”) people in the Tableau Community to see what and who they are excited about seeing in London. Today, we have Zen Master Neil Richards, Pablo Gomez, Annabelle Rincon and Tableau’s own Kent Marten.

This is part one of a special two-part series, which will conclude next week – just a week before TCE 2018. And if you’re going to be in London for TCE, stop by our booth and say “hello” or hit us up on Twitter @interworks.

Subscribe to Podcast Your Data through iTunesStitcherPocket Casts or your favorite podcasting app.

The post PYD59 – Tableau Conference Europe 2018, Part 1 appeared first on InterWorks.

The Ease of Working with JSON in Snowflake

$
0
0

After attending an in-depth technical training in Dallas, Texas, I thought it could be beneficial to give some examples of how Snowflake is unique in a series of blog posts moving forward. This week, I’m talking about JSON (although Snowflake’s functionality displayed in the article can be applied to most semi-structured data).

JSON is JavaScript Object Notation, and it is a minimal format for structuring data. JSON can be generated anywhere. Some common places JSON is generated are in Rest API calls or smart devices in response to an event or request. This creates a communication stream between a server and a web application, and it generally makes more sense to spit out a new JSON record than store the values in a relational database.

JSON is classified as semi-structured data, meaning exactly what the name implies: It’s structured … kind of. JSON is primarily composed of two primary parts, keys and values. These JSON files can quickly become a mess of complex arrays that are unreadable to the human eye. If you are unfamiliar with JSON arrays, I highly recommend reading this documentation from Squarespace that does a great job explaining them. Here’s a very basic example of a JSON array:

      “employee” : {

            “name” : “Holt Calder”,

            “title” : “Data Engineering Intern” ,

            “company” : “InterWorks, Inc.”,

            “hobbies” : [“Golf”, “Skateboarding”, “Running”, “Travel”]

      }


Here we have an employee attribute “table,” for lack of a better word. We also have the key attributes of Name, Title, Company and Hobbies, along with values for each key. Additionally, the hobbies key holds an array of values for all my hobbies, (I’m still searching for a strong skateboarding dataset for the next blog).

Now that we know a little bit about JSON, let’s investigate how Snowflake allows us to work with this semi-structured data in a familiar way using basic SQL syntax. I’m going to show you how to cast JSON to standard SQL data types, build a structured view, connect to Tableau and dominate the world with our newly transformed JSON data.

Using Weather Data as an Example

For this example, I worked with Python and the darksky.net API to gather some weather data. At InterWorks, a lot of the work we do is on-site, so traveling can quickly become a big part of the job. I grabbed data from a few places I have been fortunate enough to work in, as well as Stillwater, Oklahoma, where I’m based. I figured this could be fun data to look at, so I’m not as disappointed running in the 100° heat after work. Also, I was genuinely curious what the weather in San Francisco is this week, and just checking my weather app would make for a boring blog post.

After my collection process, I had gathered weather data for San Francisco, Toronto, New York City and Stillwater. Here is a look at the key/value structure of my data:

{       
  "currently": {
        "apparentTemperature": 70.97,
        "cloudCover": 0.39,
        "dewPoint": 45.56,
        "humidity": 0.4,
        "icon": "partly-cloudy-night",
        "ozone": 310.66,
        "precipIntensity": 0,
        "precipProbability": 0,
        "pressure": 1005.44,
        "summary": "Partly Cloudy",
        "temperature": 70.97,
        "time": 1528919028,
        "uvIndex": 0,
        "visibility": 10,
        "windBearing": 141,
        "windGust": 6.28,
        "windSpeed": 1.82
  },
  "latitude": 43.6532,
  "longitude": 79.3832
}


Now, let’s see how we can pull this into Snowflake and start building.

JSON Import

To start working with JSON in Snowflake, the first step I tend to take is creating an External Snowflake Stage. Due to Snowflake being completely cloud-based, importing data into tables requires a slightly different process, which is where the stage comes into play. The stage is almost a reference point to the S3 bucket our data lives in, which allows Snowflake to run standard COPY INTO commands. After I uploaded my JSON into an S3 bucket, I created my stage like this:

  CREATE OR REPLACE STAGE WeatherStage
        URL = 's3://*Name of S3 Bucket*/'
        CREDENTIALS = (AWS_KEY_ID = '*Your Key ID*' AWS_SECRET_KEY = '*Your Secret Key*');


Snowflake will also give you the ability to create the stage with their GUI. I tend to prefer the SQL code for simplicity. I have run into a few situations where a GUI-created stage disappears randomly. At least with the code, if that happens, you can execute it again.

Now that my stage is ready, I am going to go ahead and build a table to store the JSON data. Snowflake has a data type for Variant, which is solely for storing semi-structured data. This Variant data type means that I can upload my JSON file for each city as a row to my table. When I attempt to return a count of rows, my query will count the files that were imported from my external stage. In the table, you can also include additional columns that will store data from structured data sources alongside your JSON. For this example, I kept it simple and made a single variant column table named “WeatherJSON” and loaded data from my WeatherStage with this command:

  COPY INTO WeatherJSON FROM @WeatherStage FILE_FORMAT=(TYPE='json' STRIP_OUTER_ARRAY=true);


This command calls my stage using an “@” as an indicator, specifies the file format and lets Snowflake know to remove the curly braces that encompass the entire JSON file. This stripping of the outer array will vary depending on your source, but for the weather data, it was required to work with the data.

JSON It

Now that we have our data loaded into our Variant Snowflake table, we can start playing with the fun stuff and turn this gibberish into a relational view that we can run queries against. My first piece of advice: If you don’t know every value your JSON file collects off the top of your head, the snippet below is going to keep you from pulling your hair out … especially if you are working with a JSON file that contains thousands of attributes, like the kind a Weather API provides you:

select * from

    (select Field Name as json_field from Table_Name) v,

    table(flatten(input=>v.json_field, recursive=>true)) f

   where f.key is not null;


This query will provide you with the path to extract every key’s value. This can be extremely important because due to JSON’s structure, if you call the path incorrectly when trying to build your view, you will receive NULL values.

Now that you have a better idea of what is included in your data and how to access it, we can begin building a view that casts these JSON values to their respective data types. The standard format for this is as follows:

VariantFieldName:Key::DataType Title


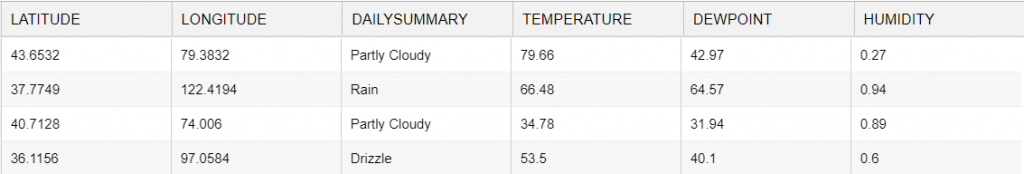
Given the example of weather data, let’s say that I want to create a sample view from my JSON files. I will select the columns I want and cast them to a data type in my view like this:

CREATE OR REPLACE VIEW vw_weather AS(

SELECT

  jsondata:latitude::float Latitude,

  jsondata:longitude::float Longitude,

  Jsondata:currently.summary::string DailySummary,

  jsondata:currently.temperature::float Temperature,

  jsondata:currently.dewPoint::float DewPoint,

  jsondata:currently.humidity::float Humidity

FROM weatherjson);


Casting each column from JSON to a standard SQL data type couldn’t be easier. Using the JSON path, I can build a view and begin querying against it as a standard relational table in a single step.

Some Final Thoughts

This is incredible technology. The standard protocols for working with JSON up to this point have included building new tables and transforming the data with complex SQL statements, sometimes using entirely different tools from your database. All of this effort in the past was required to even get the data to a usable state.

This ability to deliver a better solution in a way that uses basic SQL syntax to work with JSON is really fun. Partner this with any one of the additional features Snowflake offers and you will quickly begin to see that the value proposition is phenomenal for people who want their database to fulfill one simple task that is difficult to perform well: “Let me ask business questions.”

If you enjoyed this blog post, I invite you to follow the series! I am going to be putting new content about Snowflake out every one-two weeks. These posts will cover topics from concurrency testing all the way down to connecting Snowflake to an IDE of your choice. If you have any more questions about working with JSON in Snowflake, please feel free to reach out to me directly.

The post The Ease of Working with JSON in Snowflake appeared first on InterWorks.

Visualising the Gender Pay Gap Across Australia

$
0
0

I was raised by a single mother. For many years, my mother was the sole breadwinner of the family. Though she worked hard to provide my brother and me with the best opportunities while growing up, she faced greater challenges as a woman than her male counterparts in the same industry and role.

Keeping in mind my mother’s story, I wanted to know the current gender pay gap situation in Australia. Taking Average Weekly Earnings data from the Australian Bureau of Statistics, I used full-time adult total earnings to map out the gender pay gap across Australia, our industries and sectors. From the charts, we can see, on average, women are still earning less than men, taking home $300 less each week.

The Australian Bureau of Statistics recently releasing data showing that the costs of living are increasing by an average of 2% a year (ABS, 2018). The $300 a week could go towards much-needed food, childcare, healthcare, education or better living conditions.

In Australia, we pride ourselves on supporting the underdog and providing an equal playing field. But with the gender pay gap reducing by less than 2% over the last seven years, more action needs to be taken to truly give every everyone a fair go. In the meantime, explore the Tableau visualisation below for more insight into the issue:

The post Visualising the Gender Pay Gap Across Australia appeared first on InterWorks.

My Machine Learning Journey: Reinforcement Learning

$
0
0

When you ask someone a question, you likely have an idea of how the answer should be presented to you. For example, people will typically give you a specific time of day if you ask when they’re free for lunch. If you follow up by asking them if they’re a vegetarian, you’re probably expecting a yes or no answer.

Similarly, applying machine learning algorithms to real-world problems requires an understanding of how questions should be framed and the types of answers we expect to receive.

In previous posts, we explored regression and classification models: where regression is a good choice when seeking a numerical output and classification is a good choice when seeking a categorical or yes / no response. These approaches are great for predicting the value of a home (regression) or identifying fraudulent transactions (classification), but there are many real-world situations where neither approach is ideal.

Some Scenarios

Consider algorithms used for high-frequency trading on the stock market. This is a complex problem to solve, as the desired output from a model is more about finding the best course of action than it is predicting a numerical value or a binary outcome. Enter the reinforcement learning algorithm. This model can be used to assess the current state of the markets by being trained to take the optimal action given those market conditions. This approach provides additional value over a classification algorithm that is ignorant of the current state of the market (and therefore ill-equipped to identify the best course of action).

Alternatively, let’s consider a self-driving car as it approaches an intersection. How does reinforcement learning enable the car to select the optimal course of action to safely navigate the intersection and reach its destination?

The short answer is that reinforcement learning relies on a list of predefined “states,” where each state has a series of actions that can be taken. You can think of a state as a series of attributes describing the environment, such as the color of a stoplight or the presence of oncoming traffic.

As the curators of the reinforcement learning algorithm, it is our job to define the state variables and the values contained within them. This is a delicate balancing act. Having too few state variables risks handicapping the algorithm by leaving it blind to important information about the environment. Inversely, having too many state variables risks making the algorithm difficult to train. This tradeoff reminds me of restaurant menus – having too few items on the menu limits the ability to deliver what customers want, but offering too many options is detrimental because it spreads the kitchen too thin.

Reinforcement learning

Fig. 1: Illustration of reinforcement learning (image from Wikipedia).

Learning to Learn

The way the reinforcement learning agent learns is that it encounters a state, takes an action and then receives a positive or negative reward for that action. This process is repeated until (a) the learning agent has exhausted its training data, or (b) the learning agent completes an arbitrarily defined number of training trials. Ideally, once training is complete, the learning agent has a list of every possible state and a numerical reward associated with every possible action for each unique state. The decision process becomes a simple matter of selecting the action with the highest reward, given the current state.

There is a lot going on behind the scenes while the learning agent is trained. The reinforcement learning algorithm is controlled by various parameters, which alter how the “learning” is implemented. Keep in mind that “learning” in this context boils down to building a running tally of rewards for the actions available to any given state.

Q-Learning Explained

A common method for implementing this learning process is something called Q-learning. To keep this conversation from going off into the weeds, let’s focus only on the key components of Q-learning: learning rate, discount factor and exploration vs. exploitation.

The learning rate controls how quickly new information gained from the most recent training trials overwrites older information from previous training trials, while the discount factor controls whether the learning agent is trying to maximize short-term or long-term rewards. A learning agent with a relatively low discount factor will favor immediate rewards, and a learning agent with a relatively high discount factor will attempt to maximize long-term rewards.

Exploration and exploitation can be thought of as how adventurous the algorithm will be. We will loop back to this momentarily.

The Self-Driving Car Example

Let’s consider an example of reinforcement learning for a self-driving car in a simple environment where we only consider three things: the color of the street light, the direction of our destination and the presence of pedestrians in the walkway of the intersection. For simplicity, let’s assume our car is the only one in the intersection.

Our state variables would look something like the below table:

State Variable Possible Values
Traffic Light Green, Yellow, Red
Destination Direction Forward, Right, Left, Backward
Pedestrians Yes, No


The size of our state space is the number of unique situations which can exist, given every possible combination of our state variables. In this case, there are three street light colors, four possible destination directions and a binary value indicating if there are pedestrians in the intersection. The total number of states is therefore (3 * 4 * 2 = 24), meaning there are 24 states our model needs to consider. Four sample states are shown in the table below.

State Traffic Light Destination Direction Pedestrians
1 Green Backward Yes
2 Green Forward No
3 Red Right No
4 Red Left Yes


Let’s say there are four possible actions our car can take: move forward, move right, move left and no movement. The actions and rewards associated with the first two states shown above could look like the table below.

State Action Reward
1 Forward -1
1 Right -1
1 Left -1
1 Idle 0.2
2 Forward 0.2
2 Right 0.1
2 Left 0.1
2 Idle -1


The training process may look something like this:

Trial State Encountered Action Taken Reward Received
1 1 Right -1
2 2 Left 0.1
3 1 Idle 0.2


Now let’s consider exploration vs exploitation. After these three trials, the learning agent has tried a few actions and has a few data points to help it make decisions when it encounters “State 1” or “State 2.” An algorithm that leans heavily towards exploration will tend to randomly select an action for any given state, whereas an algorithm that leans heavily towards exploitation will select the most rewarding action associated with any given state.

This raises the question: Why would we ever choose exploration overexploitation if exploitation chooses the most rewarding action? Let’s answer this question by taking a closer look the tables above.

If the learning agent is running in exploitation mode, after three trials it will have learned that the best action to take for “State 1” is to remain idle and the best action to take for “State 2” is to make a left turn. However, we can see that the action that maximizes rewards for “State 2” is to move forward. This highlights why we want our learning agent to explore. If the learning agent leans too heavily on exploitation, then we risk getting stuck on a local maximum for our solution. In other words, if our learning agent spams the first positive reward, it encounters then we risk getting stuck in a sub-optimal solution that never branches out enough to discover even more rewarding actions.

Exploration diagram

Fig. 2: Exploration helps the reinforcement learning algorithm from getting stuck in a local maxima.

Ideally, the learning agent will try out all possible actions for each state throughout the training process. This is not possible if the learning agent gets tunnel vision on the first positive reward it finds.

Interested? Learn for Yourself.

Reinforcement learning is an excellent technique to employ when you have a firm understanding of the environment and situations you expect to encounter and you want automated decision making. If this post has piqued your interest in reinforcement learning, check out the Udacity Machine Learning Nanodegree smartcab project, where you can build your own reinforcement learning algorithm to train a (simplified) self-driving car.

The post My Machine Learning Journey: Reinforcement Learning appeared first on InterWorks.


Unlock Your SAP Data on the Snowflake Data Warehouse with Attunity and InterWorks

$
0
0

The world’s largest enterprises run their infrastructure on Oracle, DB2, SQL and their critical business operations on SAP applications. Organisations need this data to be available in real-time to conduct necessary analytics. However, delivering this heterogeneous data at the speed it’s required can be a huge challenge due to the complex underlying data models, structures and legacy manual processes which are prone to errors and delays.

In a pre-recorded webinar, we show you how Attunity, with Tableau, can unlock these silos of data and enable the new advanced analytics on the Snowflake data warehouse platform.

Hear from Attunity’s Ted Orme, Snowflake’s Graham Mossman and InterWorks’ Kevin Pemberton to find out:

  • How to extract value out of live SAP data on Snowflake
  • Why Snowflake is the perfect platform to run analytics on the cloud
  • The common challenges faced by enterprises trying to access their SAP data
  • How InterWorks can help you achieve your goals with Tableau and Snowflake
  • How Attunity Replicate for SAP is enabling organisations to unlock valuable SAP data to provide rich, real-time insights

At the end of the webinar, you’ll know how to build an end-to-end flow using Attunity, Snowflake and Tableau to show true business value from SAP data. Simply fill out the form below to start learning!

  • I understand that InterWorks will use the data provided for the purpose of communication and the administration of my request. InterWorks will never disclose or sell any personal data except where required to do so by law. Finally, I understand that future communications related topics and events may be sent from InterWorks, but I can opt-out at any time.
  • This field is for validation purposes and should be left unchanged.

The post Unlock Your SAP Data on the Snowflake Data Warehouse with Attunity and InterWorks appeared first on InterWorks.

InterWorks Makes the 2018 CRN Solution Provider 500

$
0
0

We’re thrilled to announce that InterWorks was recently named to the 2018 CRN Solution Provider 500! This is the fourth year InterWorks has received this honor, and it only reaffirms our commitment to providing quality IT and data solutions for our clients.

For those unfamiliar with the CRN Solution Provider 500, this program honors IT solution providers dedicated to delivering a wide variety of high-quality solutions to their clients. So, how did InterWorks make this list? We’re glad you asked. We attribute it to three major factors.

1. We Do It All

With our can-do attitude, we’ve never shied away from a tech challenge. If our clients have a need, our mission is to fill that need and do it with style. This has led us to forge partnerships with leading vendors in everything from security and storage to wireless networking and data visualization. Our full-stack approach enables us to be a one-stop-shop for clients, which takes a ton of the complexity out of managing the moving pieces of modern business technology.

2. We Believe in Our Solutions

Beyond simply offering a wide variety of solutions, we have rule here at InterWorks: If it’s not good enough for us, it’s not good enough for our clients. Considering we’re a company packed full of tech nerds, we have pretty high standards when it comes to the solutions we choose for our clients and ourselves. Just as important as variety is quality, and we’ll never attach our name to something less than excellent.

3. Our People Care

The most important point of all is that we legitimately care about the impact our solutions have. That means not always chasing the almighty dollar. That means sticking around after hours to make sure everything is working to complete satisfaction. Most of all, it means cultivating strong relationships where we listen and then act. We’ve said it before, but we measure our success by the success of our clients. With that in mind, we will always put them first, and that’s worked out pretty well for the past 20+ years.

The post InterWorks Makes the 2018 CRN Solution Provider 500 appeared first on InterWorks.

InterWorks Blog Roundup – May 2018

$
0
0

It seems like the warm temps are heating everything up, including the InterWorks blog! This month was a smorgasbord of different pieces. We saw event previews and recaps. There were a handful of Tableau vizzes (including an excellent Viz for Social Good piece on diversity in tech). We had some detailed walkthroughs on the power of Tableau Prep, which we’re still excited about. There’s a small army of Portals for Tableau posts. Oh, and Nelson Wong even shared his coming to InterWorks story! Long story short, there’s a little something for everyone.

Happy reading!

News and Culture


IT Services


Podcast Your Data!


Tableau Tips, Tricks and Vizzes


Tableau Prep


Portals for Tableau


OuterWorks

(Other interesting blogs we are reading outside of IW)

The post InterWorks Blog Roundup – May 2018 appeared first on InterWorks.

LGBTQ Acceptance and Media Portrayal

$
0
0

This coming weekend, hundreds of thousands of people will be celebrating Pride in some of the largest gatherings around the world. In the United States alone, revelers in San Francisco, New York City and Seattle will come together to celebrate love, diversity and, of course, progress.

Quantifying Progress

When mulling over what I wanted to do for this Tableau visualization, I wondered what data I’d find. I struggled a little – in many cases, we’ve only recently begun collecting data about issues affecting LGBTQ people. However, I was fortunate enough to come across a page at Gallup’s website where many questions have been tracked over the years. All sorts of data about LGBTQ individuals serving in the military, or workplace discrimination, or whether same-sex marriage should be legal. Some questions have changed over the years; for example, questions about civil unions stopped being asked in 2005.

While browsing through this data, I thought of how 20+ years ago, there weren’t many publicly out LGBTQ individuals. In fact, it’s amazing to think when Ellen DeGeneres came out 21 years ago (21 years!), it was announced via a Time magazine cover story, an Oprah interview, a themed-episode of her sitcom. Today, such an announcement might warrant a tweet.

Visualizing the Results in Tableau

Looking at Gallup’s data, I started thinking about the relationship between media representation of LGBTQ individuals and how common it is to be “out” today. Honestly, I’m not sure which causes which, but both factors have clearly been at work to get us where we are today. With some guidance from a design rockstar (a.k.a. my coworker David Duncan), I made a data visualization using Tableau that shows some of those changes over the years.

Happy Pride, everyone!

The post LGBTQ Acceptance and Media Portrayal appeared first on InterWorks.

Tables in Tableau: Jazzing It Up with a Purpose, Part 1

$
0
0
Final Alert Table in Tableau

In the world of data visualisation, there is a love-hate relationship with tables, also known as crosstabs.

The truth is, as with any other type of data visualisation, tables have a space in the analytical world and are customarily used or even required by some industries, such as finance where the appetite for balance sheets, cash-flow statements and bank-reconciliation reports is a daily necessity.

Tables in Tableau already have best practices in mind, applying row banding to help the user keep track of the data corresponding on the row. The columns, on the other hand, are simplified with the absence of column dividers or banding as the human brain has the propensity to naturally align elements vertically.

Personally, I tend to favour a more visual form to display outliers, patterns and trends. But when a need for a table arises, I try to add some visual aids that not only enhance the analysis but also make it user-friendly to a wider audience.

With this, I don’t mean to advise on the redesign or “beautification” of a table just because “it is plain and boring.” Rather, given the purpose and the audience, elements such as colour, shapes and ASCII codes can be added to a standard crosstab.

This will be a table blog trilogy, but today I will walk you through the redesign of one table, depending of the use case and outcome required.

Crosstab

Option 1: “Alert Table”

Use case: A table that displays several measures and simultaneously gives a visual clue based on the RAG (Red Amber Green) Status.

Alert Table in Tableau

How to?

  1. Create a table with the data you wish to display. To colour with a discrete colour palette, we must create a discrete calculated field with the conditions we want to highlight, like so:
    Code Calculated Field
  2. Drag the newly created calculated field Code to the Colour card on the Marks shelf and change the mark type to Square:
    Square Mark Type
    The table will be looking like this:
    Adjusted Alert Table
  3. The next step is to resize the square so the colour fills all the corresponding cell. On the Size Marks card, use the slider to the maximum size:

Mark Size
Although we increased the size, the highlight table doesn’t look right because the squares bleed into the neighbouring cells.

Alert Table Square Bleed

Luckily, Ryan Sleepers’ Jedi trick of adding a second discrete field to both the Columns shelf and Rows shelf will correct it. With this we will add a “blank” dimension. To do so, double-click in an open area of the Columns shelf, type two quotation marks and hit the Enter key:

Alert Table Trick

The headers of the blank dimension can be hidden by right-clicking on the newly created dimensions and deselecting Show Header.

The remaining formatting steps are personal choice and preference, however because we are using a discrete field to colour the table, the border formatting is no longer on the Colour Marks card but controlled by the Row Divider and Column Divider options on the Format pane (right-clicking anywhere on the view, choosing Format and navigating to the Borders tab).

One other way of getting this type of output without using blank calculated fields:

  1. Create a table with the data you wish to display. To colour with a discrete colour palette, we must create a discrete calculated field with the conditions we want to highlight, like so:
    Discrete Calculated Field
  2. Drag the newly created calculated field Code to the Colour card on the Marks shelf and change the mark type to Gannt:
    Mark Type Gannt
  3. Resize the Gannt chart on the Size Marks card, using the slider to the maximum size.
  4. Now “the James Austin hack” tells us to drag the Number of records field the Size Marks card and change the aggregation to AVG:
    AVG(Number of Records)
  5. Remove the grid lines by using the Format pane and you should have the following output:

Final Alert Table in Tableau

Option 2: “Colour by Different Measures”

Use case: A table that displays several measures with separate colour ranges depending on the measure.

Colour by Different Measures

  1. Create a highlight table with a measure and dimensions you wish to analyse. Add the following measures to the table.
  2. Right-click on the field Measure Values present on the Colour Marks card and select Use Separate Legends:
    Use Separate Legends
  3. Format the colour legends, choosing different colours or hues of the same colour if the measures are related or have the same unit.


NOTE: This table type should be used with caution as it isn’t best practices and too many colours may hinder the analysis and user experience.

Stay tuned for Part II, where we will cover different ways to display negative values in tables.

The post Tables in Tableau: Jazzing It Up with a Purpose, Part 1 appeared first on InterWorks.

Viewing all 2695 articles
Browse latest View live