Quantcast
Channel: InterWorks
Viewing all 2695 articles
Browse latest View live

Portals for Tableau New Feature Spotlight: API Relay

$
0
0
Edit API Relay


You’ve got a Portal for Tableau. You’ve got Dataiku. You’ve also got an ingenious idea to use some of the data science from your awesome new Dataiku project on your portal’s frontend. For instance, you want to provide an interactive form to predict the weather at a user’s location, or maybe something actually useful like which traits your future baby with a specific celebrity will have.

You think to yourself that Dataiku provides a REST API, so this should be doable. You realize for security reasons that you’ll need the backend of the portal to do the heavy lifting of connecting to Dataiku’s API instead of pure AJAX. However, this means you need to write a fairly complex script using the portal’s integration feature to act as that middleman between the frontend and Dataiku. You’ve mastered frontend development, but writing a Python script to interact with an API is daunting.

This isn’t just true with Dataiku. You can replace it with any number of other systems that provide a REST API. Building out scripts to act as middlemen is still just as daunting.

Portals for Tableau Make It Easier

Portals for Tableau now provides API relay functionality to make this process easier. You’ll still need someone with frontend development chops to communicate with the API relay and process the results, but having the portal make calls to your desired API is much simpler.

To add a new relay, log in to your portal’s backend, navigate to Integration > API Relay, and click the New API Relay button.

From there, you’ll enter a name and description for the relay. Next, you’ll specify the target API’s URL.

Edit API Relay

If the target API requires any request headers, you can specify those in the Request Headers sections by specifying each header as a key/value pair.

Request Headers Section

If the target API requires any request variables that are fixed, already known and/or need to remain a secret (such as keys, token, etc.), then those need to be specified in the Request Constants section. Each variable will be added as a key/value pair.

Request Constraints Section

If the target API has any other request variables, those need to be specified in the Request Variables section.  You’ll only need to set the request variable’s name, since you’ll pass the value in at the time you use the relay. Additionally, you can specify whether each variable is required or optional.

Request Variables

Once you create the API relay record, you’ll see an example link you can hit from your frontend code, which will execute the relay.

API Relay Link

Here’s an example of the response you’ll get when using the API relay:

API Relay Response

The post Portals for Tableau New Feature Spotlight: API Relay appeared first on InterWorks.


Superior IT Service in a Service-Weary World

$
0
0

I slammed the phone down a bit harder than the last time. I felt my face redden, the tendons in my neck tense and small beads of sweat erupt from just below my hairline. For the third time today, I had been tossed from human to human after listening closely because the menu items had changed, and I had pressed one for English only to wind up where I began: nowhere.

Multi-national corporations have us by the short hairs. We have little choice but to accept their gauntlet of support – their dreadful indignity. We keep calling. We continue to absorb the abuse, and our outrage thickens. If just once someone would break script and empathize with your plight, decades of malady could be swept under the rug of forgiveness. Chances are, you too will instead be slamming down your phone with ice in your veins.

I work in an industry of service. IT consulting promises one thing: inconsistency. One moment you are on top of the world having just solved the greatest mystery since the advent of sliced networks, the next you are 1000 miles below the ocean floor drowning in the toner cartridge of an aged laser printer. It is an emotional rollercoaster with a rusted metal track. It can oscillate between the most thankless and most rewarding job in a matter of minutes. These ups and downs fracture the one area that should remain consistent: the treatment of our clientele. Our vocation is nothing without the consumers of our services. In the simplest and most clichéd of terms, the customer comes first.

Call center

Above: Support frustration often conjures up images of empty call centers devoid of helpful people.

A Crash Course in Customer Service

The first job I had was a waiter. If I can pass one thing off to my kids, it is to be a waiter early in their working life. At the base level, waiting tables is a crash course in customer service. One cannot live on $2.13 an hour, so tips are expected to make up the difference. I could diverge here and discuss my honest thoughts on tipping, but when it comes down to it – you either provide good customer service or you don’t make money.

I worked at a now-defunct family diner in my hometown. While the town is small, there is a major university with a high focus on sports teams. Once, I remember a large crowd, 15-20 people, walking in the door 20 minutes before close. Many of the chairs had already been placed on the tables and mopping had begun. One of the people in the group was a well-known, well-respected coach at the university. I was a fan, so I was honestly excited to wait on this large group. My co-workers would finish the mopping and other closing duties and I would handle the waiting myself and collect what I imagined would be a significant tip to end the night.

Meals were ordered and drinks were delivered. I keyed in all the food selections and walked back into the kitchen to talk with the cooks. I had not anticipated their reaction to a 20-plate order being placed 10 minutes before the doors were to lock. Immediately, I felt their disdain. They slammed plates down, spoke (yelled) in a level clearly audible to anyone dining in the restaurant and were not shy to let me know of my role in their misery.

I felt my mood change. The feeling of hospitality vanished. I too was being inconvenienced by the audacity of these patrons traipsing in the door so late in the evening and expecting a high level of service. Subtly at first, my interactions with the party morphed. Maybe the smile vanished from my face, then my movements became a bit more exaggerated. Perhaps there was an air of animosity in my exchanges. As time progressed and the client requests became more abundant, the subtilty became blatancy. None of this was a conscious alteration in my behavior; it was a reaction to my environment.

When the night was done, an hour past close and the interlopers had departed, I was left to clean up the grot. I bussed plates and cups, muddled my hands with syrup and left-over applesauce and wiped tables clean. Suddenly it occurred to me – there was no tip. I had just spent one and a half hours catering to every need of these heathens and what I had to show for it was a thumb soaked in a bowl of cold grits, and $3.19 before taxes.

I have played the night over and over in my head for 20 years (I know, maybe I need therapy). I will never truly know why there was not a tip left. It could have been because they believed the tip was included in the bill, as many restaurants do for larger parties. Personally, I have chosen to believe that the reaction of the cooks and then my subsequent transmutation left the assemblage feeling slighted. They had not received the level of service that they expected or deserved and punished me via my wallet. It would not have taken much for me to bite my lip and tough it out for an hour. It could have meant a big bonus for my night, but instead, it was a lonely night and 20 years of memories.

Defining Good Service

What is good service to you? I bet it is the same for me. At the highest level, this is not typically something that differs from person to person. We want to be respected and acknowledged. It sounds so simple, so why is it so hard to get that level of consideration? As in the story above, my environment had evolved negatively. I was being bombarded with unproductive, uncooperative influences. I let it seep into my actions and affect not only me but everyone with whom I came into contact.

These negative influences are unavoidable. In a consulting world, people do not typically call because they are happy that their email is down; they call expecting immediate resolution to a problem you should have already known about. You can take their charged interaction and turn it back on them, or you can empathize with their situation and calm the waters before they begin to boil. Acknowledge their frustration; let them know this is now your top priority. Make them feel like you have merely been sitting there waiting for them to call. They are your only client.

It may take the biting of a tongue or the swallowing of pride, but in the end, you will be tipped with gratitude. At InterWorks, we call our service White Glove. Not terribly creative, I know, but it is what we strive to provide. When we run our gloved hand over the issues that were addressed today, does the finger come back clean? Clients don’t get shuffled from technician to technician when they call in. If it is not your regular client, it does not matter; today they are.

One thing that has been a focus of late is our method of communication with the user. More than half of the incoming requests arrive to us via email. It is exceedingly simple to reply to that message with troubleshooting steps and wait for a return message with results. Soon, we find ourselves 10 emails deep in a thread, repeating things that were described several messages back, weaving a web of confusion. If the technician had picked up the phone after the first back and forth, perhaps the issue could have been rectified expeditiously, leaving the client with a feeling of importance and respect.

InterWorks culture

Above: It’s important to know that there are actual, relatable humans on the IT support side.

The Importance of Service-Minded Partnerships

At InterWorks we value our partnerships. We don’t just jump into a relationship with a vendor for the sake of the name. They need to be more than a shiny box or snappy marketing campaign. With most of our partners, we regularly find ourselves in technical conversations while troubleshooting or testing a solution. If the support we receive is not up to par, it causes delays, confusion and possibly even a consultant who is no longer willing to implement the solution.

I have blogged about ESET in the past. Sorry to do it once again, but I must salute their customer service. ESET is a large company with 1300 employees and around 580 million in revenue. They are headquartered in Bratislava with their U.S. headquarters in San Diego. You would think a company of this size would send support seekers down a “your call is important to us” wormhole, but that is not the case. When you call or chat with ESET, you can typically talk with a tech very quickly. They often resolve my issue or answer my question within five minutes of reaching out. Do they always fix the problem on the first call? No, but I have never been told that I will be contacted by subsequent tiers of support and that not actually occur.

What does this do for me? I don’t dread the call to ESET support. I do not hesitate to reach out, potentially spinning my wheels on a problem, for fear of the level of service I will receive. They have made me feel important and respected, no matter the silliness of the topic I produce. It would have taken one second on the first call I had with ESET to sour their reputation and defeat any future process or partnership with our company. It only takes one sentence for you to annihilate or cultivate a valuable relationship with your client.

Take away this, if nothing else: You are the voice of your company. How you present yourself, how the employees represent the company, is the ONLY thing you are selling. A more superior product has never and will never be developed.

The post Superior IT Service in a Service-Weary World appeared first on InterWorks.

Combining Data with Joins

$
0
0
Outer Join Results

I rarely ever receive pristine data, and I’d wager that’s true for most of us working in data analysis or business intelligence. Data can come to us from dozens—if not hundreds—of sources, and it certainly requires some preparation to make it useful. One of the most common data preparation tasks is to combine columns from multiple tables — a process called “joining.”

There are several tools that can help us join data together, but I want to focus on the theory of joins in this blog post. This won’t be a how-to kind of post but rather a quick explanation of the different ways we can join data and some of their effects. Let’s dig into it.

What Is a Join?

A join is a process that combines tables from one data source (like tables in SQL or sheets in an Excel spreadsheet). Imagine we have the two tables below: one table, on the left, shows the top 10 movies of 2017 sorted by domestic gross, along with their opening dates. The second table, on the right, lists movies that I watched during 2017, along with my personal rating from 1-10.

Two tables

If I wanted to analyze all of this information together, I’d have to figure out some way to combine these tables, and that’s exactly what a join will do. When we join these two tables, we will merge their columns together into one new table. We’ll need a unique identifier for every single row. In this case, that will be the movie title. This is called our join key, and we’ll use it to put the data in the correct location. But there are a few different ways we can choose which rows make it into the final table, so we’ll need to understand the four different join types.

Inner Join

The first join type we’ll consider is the inner join. This process retrieves only the rows that are common to both tables. Below, I’ve highlighted those rows in gray. We can see that “Beauty and the Beast (2017)” is in the left table but not in my list of movies on the right. Similarly, “Coco” and “Wonder” are in my list of movies but not in the top 10 by domestic gross.

Inner join

The result of the inner join is the table below. The blue columns came from the left table, Top 10 by Domestic Gross, and the orange column came from the right table, Zac’s List of Movies. Note that the only movies in the result set are those that I saw and rated in 2017 yet also in the top 10 table.

Inner Join Results

This has effectively filtered our resultant table; it only returned the top 10 movies if I had seen and rated them, and it only returned movies I had seen if they also grossed highly.

Left Join

We may want to return some rows regardless of their existence in the other table, and the left join can help us do that.

The left join treats one table—the left table—as the primary dataset for the join. This means that every row from the left table will be in the result set, even if there’s no rating from the right table. Below, I’ve highlighted the rows that the left join will return.

Left Join Before

But what about those movies that don’t have a rating? What will go in the My_Score column for “Beauty and the Beast (2017)” or “Despicable Me 3?” Since there is no data to put in the table at those spots, the join will simply put NULL values there. We can see this in the result set below.

Left Join Results

Right Join

The right join is conceptually very similar to the left join, but it treats the table on the right as the primary dataset. This means that every row from the right table will be shown in the result set, but “Beauty and the Beast (2017)” and “Despicable Me 3” will be filtered out. So, the highlighted rows below will make it to our result set.

Right Join Before

In the resulting table, we can see that “Coco,” “Wonder,” “Kingsman: The Golden Circle” and “Dunkirk” are present in the rows, but several of their columns have been filled with NULL values since there was no data for those movies in the left table.

Right Join Results

Outer Join

The final join type is the broadest and NULL-iest: the outer join. This process keeps rows from both tables and fills in NULL values where necessary. Any movie in the top 10 domestic gross table will make it into the result. Likewise, any movie in my personal table will make the cut. Below, we see that every row is highlighted gray.

Outer Join Before

When we perform the join operation, we get every single movie, as well as NULL values wherever there is missing data.

Outer Join Results

So, joins let us combine columns from multiple tables, but it’s important to remember the effects that the join type can have. Inner, left and right joins will filter your data and reduce your result set. Outer joins will include every row but have the potential to include a lot of NULL values. As always, thinking about your goals and choosing the right tool for the job will lead to the best results.

The post Combining Data with Joins appeared first on InterWorks.

Portals for Tableau New Feature Spotlight: Report Builder Cover and Footer Pages

$
0
0

When you’ve had a taste of Portals for Tableau’s report builder functionality, you invariably want more. It started as simply taking snapshots of several dashboards and exporting them as a Microsoft PowerPoint presentation. Then, it was exporting those same snapshots as a PDF file. Next, there was the ability to set a PowerPoint template, control the orientation and override those settings at a Tableau user group level. But you still have a thirst – a thirst for more report builder functionality.

Covers and Footer Pages for All

We don’t want to throw around the term “enabler,” but we are here to help. To make the reports you export just that much better, the portal provides functionality to set any number of cover and footer pages. You can use these to add your company logo at the beginning of every report or quiet your legal team like a momma bird feeding her loud, chirping young by adding a confidentiality agreement at the end of every report.

To set the cover and footer pages, just upload them as high-resolution PNG images at Backend > Content > Files, then set them as either a cover page or a footer page, or both if you want to get extreme, by going to Backend > Settings > Portal Settings > Layout Tab.

Cover Page & Foot er Page Setting - Portals for Tableau

But Wait, There’s More!

Oh, and I’m not done yet! We’ve gone even further. You can also set different cover and footer pages for every Tableau group if you need even more functionality to satisfy your situation. If you’re using your portal to serve dashboards to your own clients, each one of those clients can have their own logo at the beginning and terms of usage at the end.  Maybe you’ve got a group of users who have wronged you in the past and you want to call them out whenever they export their slides. You can do that, though I probably wouldn’t advise it.

To set the cover and footer pages for a certain Tableau user group, navigate to Backend > Settings > Frontend Group Overrides > New Group Override > Layout Tab.

Cover Pages for Groups - Portals for Tableau

The post Portals for Tableau New Feature Spotlight: Report Builder Cover and Footer Pages appeared first on InterWorks.

Using Shapes as Filters in Tableau When Your Fields Are Measures

$
0
0
Icons as filters in Tableau

We’ve seen how to use shapes as filters (you can also download this Tableau workbook), but what if you want to use shapes to filter results based on different measures? I was recently asked by a client to develop a dashboard that would update by clicking on icons, but the icons were actually measure fields (continuous rather than discrete). After asking the community for help but not finding the ideal solution, I came across my own idea.

Let me explain the problem using something we all know well …

In the Tableau Superstore dataset, if you wanted to look at sales by state and sales by category, but then switch the view by clicking an icon to show profit by state/category or quantity, how would you do it?

The Separate Tableau Dashboards Method

My way involves using separate dashboards for each shape/measure.

  1. Firstly, add the images for your shapes or icons to Tableau Repository. You can find images online for this, e.g. https://www.flaticon.com/, but remember to credit the author! For details of how to add to Tableau, see link above.
  2. Create an icon worksheet. In Excel, add a list of the icons under the field name “Icon”. Copy and paste this from Excel directly onto the canvas in Tableau and this will create a clipboard data source.
    Icon field
  3. Rename the data source to “Icons,” then create separate worksheets for each icon, e.g. “Sales icon” (filter on the relevant icon, select shape on the Marks card and select the desired shape).
  4. Create your first dashboard with visualisations using your first measure, e.g. sales. Add a horizontal or vertical box to the dashboard and add all icon worksheets (hide title, fit entire view), then make sure the fit is distributed evenly. Label the dashboard so that you know which measure you are looking at (this will be helpful when you are creating action filters).
  5. Duplicate the dashboard and replace the visualisations with duplicated versions that use your other measures, e.g. profit and quantity. Label these dashboards so that the measure used is clear.
  6. Now you need to create action filters on each dashboard that will enable users to click on the images and navigate them to other dashboards. You need an action filter for each image on each dashboard. Label well so that you know which dashboard you are going from and to, e.g. “Sales to profit.” The source sheets will serve as the starting dashboard, so only select the icon you are clicking on (run action on select). The target sheets will be the dashboard you want to navigate towards, so only select the visualisation worksheets (you must deselect the icon worksheets as clearing the selection will show all values).
    Sales to profit filter action
  7. Once you’ve completed the above step for all icon to dashboard options, users can use the images to navigate between dashboards. Take a look at the final result in the GIF below, then download this Tableau workbook to see how it’s set up.

Icons as Filters Tableau Dashboard


The post Using Shapes as Filters in Tableau When Your Fields Are Measures appeared first on InterWorks.

How to Properly Render Custom Fonts in Tableau

$
0
0
Tableau - Format Dashboard - More Colors... - Shading

Times New Roman? How did that happen? That’s not the font I used!

As I walked around the room, I noticed that several of my colleagues were seeing my dashboard with an entirely different font than the one I had chosen. It was one of the first major dashboards I had developed, and I had been very thoughtful about the design, incorporating the company’s font to ensure it looked on-brand. So, you can imagine my internal panic as I discovered that the font wasn’t rendering properly on everyone’s screens.

If you’ve ever ventured from the standard Tableau fonts, you may have had a similar experience where a font looks great in Tableau Desktop but turns out pretty whacky when you publish it. Tableau recommends that you only use “web-safe” fonts (fonts that are installed by default on all web browsers) to ensure proper rendering, but that really limits your options, which can be especially frustrating if you’re aiming for a well-designed dashboard.

So, how can we create dashboards with eye-catching titles and ensure that they show up properly on all users’ computers?

I learned a great tip (well, tips, actually) from the “Hitchhikers Guide to Dashboards” presentation at TC17. Ashley’s overall advice was to approach dashboard design more like we approach magazine layout: Big images. Rivers of white space. Sexy fonts. Lately, I’ve been trying to follow Ashley’s lead by using interesting text and blank space to help viewers find an entry point into unfamiliar dashboards, which has led to some #MakeOverMonday projects that turned out like this:

UK Favorite Chocolate Bar Romantic Partner Viz

Dashboard Titles as Images

To avoid another Times New Roman panic, I’ve been including my dashboard titles as an image instead of as a text box. It takes a few more steps, but it’s totally worth it if you want a polished look. Here’s what you need to do:

  1. Open up a Word document (or PowerPoint, or anything else you can use to lay out some text). Type up your text and apply your custom font and sizing. Pro Tips:
    1. Ashley recommended 1001freefonts.com as a great place to download free, custom options if you don’t like any of the fonts available in Word.
    2. You may need to use text boxes to customize the layout in Word if you’re going for really narrow spacing or unique alignment like I did in the examples above.
  2. If your dashboard has a custom background color, grab the RGB code and set the same background color in your Word document using the following steps:
    1. From the Format Dashboard pane, click More Colors… on the Shading drop-down menu:
      Tableau - Format Dashboard - More Colors... - Shading
    2. Record the Red, Green and Blue numbers:
      Select Color
    3. Click on Page Color in the Design tab in Word and then select More Colors…
      Page Color - Design - More Colors...
    4. Copy your RGB numbers here to get the same background color:
      Custom Color
    5. Once you have your text laid out the way you want it, use the snipping tool on a PC (or Command + Shift + 4 on a Mac) to take a partial screenshot of your text and save it as an image.
  3.  Then all you need to do is insert an image container into your dashboard and select your screenshot.


You’ll need to choose a web-safe font to use for labels and axes in your actual charts, but you can upload additional images if there are other headers or titles you want to emphasize in your dashboard. You may have to play around with the size of the container (or even make some adjustments in your Word doc and take another screenshot) to get the titles exactly the way you want it. Once you perfect your layout, you can be sure that it will look just as perfect to everyone else who views your dashboard. No need to fear another Times New Roman failure.

For more tips on dashboard design, check out these Visual Best Practices from our Tableau Deep Dive series.

The post How to Properly Render Custom Fonts in Tableau appeared first on InterWorks.

PYD56 – Tableau Prep With Isaac Kunen And Arthur Gyldenege

$
0
0

Tableau Prep (formerly known as Maestro) came out with the Tableau 2018.1 release and we got to talk to a couple of the men who helped shape it! Analytics Consultant Mat Hughes sat down with Isaac Kunen and Arther Gyldenege about their journey in creating Tableau Prep, the importance of listening to users’ feedback and the future of Tableau.

Subscribe to Podcast Your Data through iTunesStitcherPocket Casts or your favorite podcasting app.

The post PYD56 – Tableau Prep With Isaac Kunen And Arthur Gyldenege appeared first on InterWorks.

Tableau Prep: How to Cleanse Your Data and Prepare It for World Domination Analysis

$
0
0
Tableau Prep - Remove Punctuation

Hello again, data friends. My focus for this blog post will be the variety of formidable data cleansing options available in Tableau Prep (TP for short). I long for the day when data arrives clean – no bogus characters, mismatched naming conventions and or even duplicates. While I’m dreaming, I’d also love to have a private island and an unlimited supply of coffee ice cream. Unfortunately, that isn’t happening, and sets of data will always need massaging and wrangling.

For this (and forthcoming) Tableau Prep how-to blog post(s), we’re going to be looking at some spaceship manufacturing, sales and pricing data. The year is 3015, and I am the Sales Manager for Toyota. Sales for the company have struggled as of late, and I need to dig into both mine and my competitors’ numbers and see just how our models are stacking up in price, sales and specifications. Let’s dig in!

Set Phasers to Cleanse

The year may be 3015, but data management has frozen in time. In this example, I have a variety of .xls, .xlsx and .csv files with similar elements that I need to combine for analysis in Tableau. Before I can build visualizations on these data sources, I need to make sure my disparate data sets contain valid information and can talk to each other. Chances are, since my base files are from a variety of different sources and systems, there are going to be some anomalies that need addressing.

Opening the ship_sales_dataset1.xlsx file, I can already see some potential issues:

XLSX File

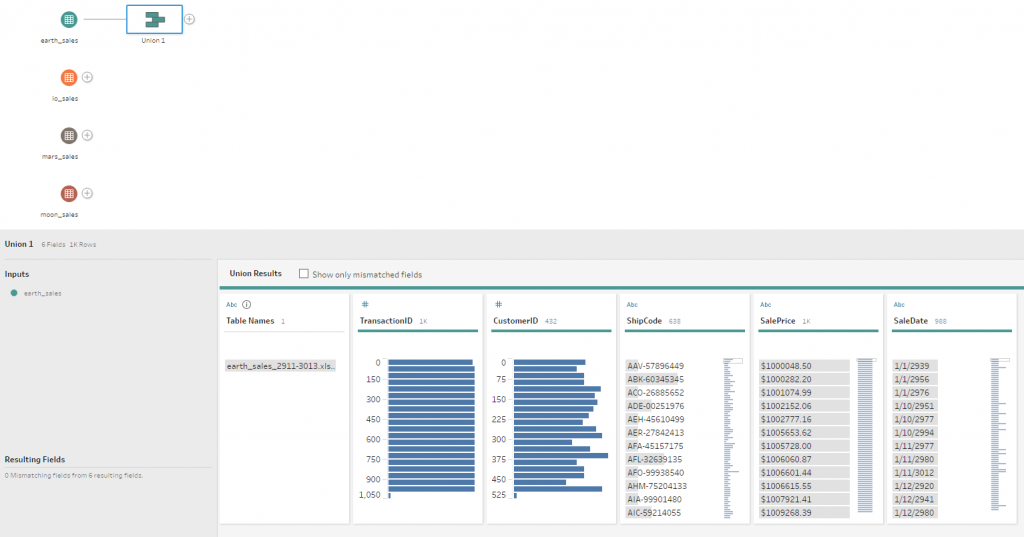
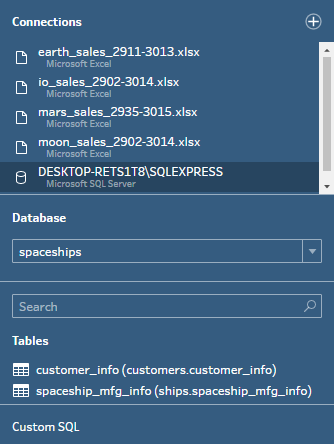
Now that I have an idea of what I’m dealing with, I’m going to put this file into a Tableau Prep flow and do some data profiling. First, click the + sign by Connections and add the Excel file to Tableau Prep, then drag the sheet you want out onto the flow if necessary. Once I have our sales data loaded up, if I click to add step I can see that the Profile pane now shows me a nice summary of the fields:

Tableau Prep: Add Step - Profile
Since I know this dataset is from a system prone to human error, one of the first things I’ll do is look for abnormal values. If you’re familiar with your data, like I am with Ship Makers, for example, the anomalies will be easy to spot by simply sorting the desired column by count, and then eye-balling the singular values for errors:

Tableau Prep - Sort by Count Tableau Prep - Single Out Errors

I can see right away that these values should be Ford and Maybach, respectively. Instead of manually grouping and replacing these erroneous values, I’ll let Tableau Prep work its magic and then clean up anything left over. For this field, a common character group and replacement makes the most sense since any “bad” fields are likely a result of bad data entry or concatenation:

Tableau Prep - Common Characters

After I run the common character group and replace cleanse, I can scan through the results and see what Tableau Prep was able to fix for me. Here we can see that GMCC was automatically re-mapped to GMC (good), but it was unable to combine FordGMC into Ford like I expected:

Tableau Prep - Remapping

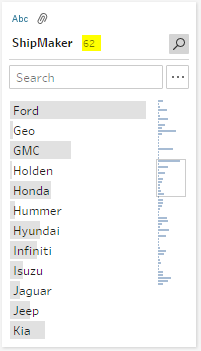
That’s easy to fix; however, I can simply manually group FordGMC into Ford! Once you’re done making changes, clicking Done will essentially commit your groupings. As you can see, Ford and GMC are fixed and there is no trace of the incorrect values. Our distinct ShipMaker count is now 62, reflecting the fix made to the inaccurate fields:

Tableau Prep - Updated Count

Moving on, I know my boss prefers to see ShipMaker in all caps. This is an easy fix in Tableau Prep, simply click on specific field’s drop-down and in the Clean sub-option, selecting Make Uppercase will adjust your values as such:

Tableau Prep - Make Uppercase

Now that I’m happy with my ShipMaker field, I’m going to go through similar steps on the ShipModel field. Since there are so many distinct values (537), I’m going to tell Tableau Prep to take a pass at common character grouping and replacing. Scrolling through the results (changes identified by the paper clip), I can see some wanted adjustments, like this one to Avalon:

Tabelau Prep - COmmon Character Grouping and Replacing

There are some groupings that I think are incorrect or am not sure of just yet, like this one, so to revert I’ll simply uncheck the 330 and remove it from the grouping:

Tableau Prep - Incorrect Groupings

Side note: If you go a little too fast, like me, you can easily revert any committed adjustments with an undo command, or by opening up the Changes tab and removing the unwanted alteration by clicking on the corresponding X:

Tableau Prep - Group and Replace

Moving on to ShipCode, I know this field is supposed to be in an alpha-numeric format with a three-letter prefix and eight-number suffix, e.g. ABC-12345678. Keeping that in mind, I’m going to sort this field alphabetically, so any incorrect prefixes will stick out, like these:

Tableau Prep - Sorting Alphabetically

To fix, I’ll manually adjust with a right-click and Edit Value:

Tableau Prep - Edit Value

My boss also hates hyphens, so I will go ahead and Clean off the punctuation as well:

Tableau Prep - Remove Punctuation

Continuing with our cleansing crusade, we come to the MfgLocation field. I’m not familiar with all of the cities, but I do know these numerical values are wrong. I’m not sure what they should be, so I’m just going to turn these into nulls:

Tableau Prep - MfgLocation Field

This field is a good candidate for a pronunciation-based group and replace, so I’ll have Tableau Prep work its magic again and review results for possible consolidation:

Tableau Prep - Pronunciation

I’ll have to check with the regional specialists on some of these spellings, but it’s possible that these could be data entry errors. I’ll remove the ones I’m not sure of and commit the others. If I’m wrong in my assumptions, no worry – I’ll simply revert the changes via the changelog:

Tableau Prep - Group and Replace

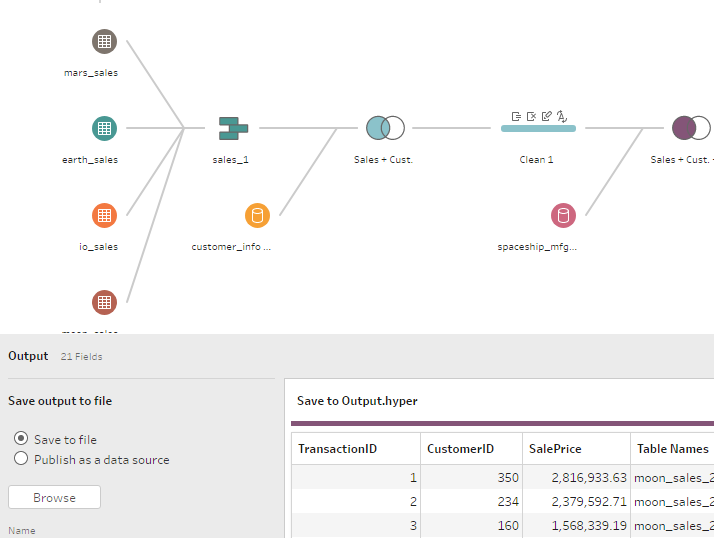
Now that I’ve got a clean set of values to work with, I can move forward with my data preparation and transformation. Here’s more information on the available sub-options under Clean in Tableau Prep. All of these are very useful for quick and painless transformations:

  • Make Uppercase: Change all values to uppercase text.
  • Make Lowercase: Change all values to lowercase text.
  • Remove Letters: Remove all letters and leave only other characters.
  • Remove Numbers: Remove all numbers and leave letters and other characters.
  • Remove Punctuation: Remove all punctuation.
  • Trim Spaces: Remove leading and trailing spaces.


What’s Next in Tableau Prep?

In my next posts, I’ll show you how easily Tableau Prep can transform your disparate data sources through joins, pivots, unions, aggregation and much more! In the meantime, please reach out to us today and let us know if you have a specific question or want more information on Tableau Prep or any of our partner products.

The post Tableau Prep: How to Cleanse Your Data and Prepare It for <del>World Domination</del> Analysis appeared first on InterWorks.


Event Debrief – April 2018

$
0
0

InterWorks had huge successes over the past month as we had events across the nation alongside our partners! Check out the slideshow below for some pics from our recent events, then read on for more info on what we’ve been up to.

  • Boston Brewalytics
    Boston Brewalytics

Brewalytics and More

On our business intelligence side, April’s events went coast to coast as we collaborated with Tableau to kick off our Brewalytics tour. We had embedded analytics discussions at local tap houses in several cities including Brooklyn, Boston, Chicago, Los Angeles and Washington, D.C.

InterWorks Analytics Consultants Matt Albacete and Mark Bingham started the tour off and worked together to put on a successful Brewalytics in Chicago, Illinois. From there, InterWorks went to Los Angeles, California. InterWorks Director of BI Markets and Delivery Eric Shiarla and Solutions Architect Derrick Austin tag-teamed the presentation to talk about the Data Journey and how it coincides with embedded analytics. One of our last stops included InterWorks Analytics Consultant Ben Young taking the tour to Washington, D.C.

Our partnership with Tableau representatives is also noteworthy within these events. Representatives Jason Filatov in Los Angeles and Austin Tru in Boston did more than just attend; they also gave presentations alongside our InterWorks folks. To add a cherry on top, we also had a presentation by Sonny Hizon from Radiology Partners, sharing how InterWorks and Tableau helped consolidate the company’s data and led them to success.

We wrapped up this tour with InterWorks Director of Strategic Innovations Dan Murray sharing his expertise on Tableau in Brooklyn, New York, and Boston, Massachusetts, to 100+ attendees. To say that this tour was a success is an understatement.

Brewalytics was not the only thing that was happening this month on our BI side. At the beginning of April, we sent our folks to a Snowflake World Tour in Chicago. Snowflake is a newer partnership, but they are doing big things and we had to check it out.

IT Lunch & Learns

While we were touring the U.S. with our Brewalytics events, we finished our IT lunch and learn Spring Series with Dell EMC. InterWorks Solutions Architects Brad Fair and Derrick Austin wrapped up the series with a presentation on insight. We were able to show IT Services professionals in the Tulsa and Oklahoma City areas how Tableau can assist them in organizing their data.

EU Events

While we were very busy in the U.S. with events, our EU Events Team kept busy as well! They continued our Data Discovery Days in Frankfurt, London and Munich. They also had an event in Vienna centered around film and television data where they showed the functions of Tableau through a demonstration utilizing that data.

That’s a wrap for this month’s events! Stay tuned next time to hear how we are planning events in Australia, Brewalytics in San Francisco and more!

The post Event Debrief – April 2018 appeared first on InterWorks.

Portals for Tableau New Feature Spotlight: Report Builder Emailer

$
0
0

Portals for Tableau’s report builder functionality is great if you are preparing to give a presentation and want to use the visualizations as evidence that what you’re saying isn’t just made up on the spot, and people in the audience should actually pay attention to what you’re saying instead of reading “15+ ways you’ve been brewing coffee wrong” on their phones, even though number seven will actually change their lives.

However, sometimes the information you need to share isn’t worth the battle to set up a conference room, prepare a 30-minute talk, fight with the projector to display your presentation, deal with the constant interruptions from staff that “have to take this call” (you’re not that important, Bob!), and then answer a slew of questions that have nothing to do with what you just presented.  Sometimes simply emailing the slides to a few people is enough.

Enter the Report Builder Emailer

Instead of having to build the report, download it as a PDF, compose an email, send it to the three people who need it, remember that you forgot to attach the report to the email, and resend the email with it attached this time, you can now have the Portal for Tableau do all of that grunt work for you. As long as your portal has been configured to send email, you can now turn on a feature that allows you to send the report directly from the report builder menu.

To enable the email ability of the report builder, navigate to Backend > Settings > Portal Settings > Features tab and toggle on the Report Builder Email Option. Don’t forget to save.

Report Builder Email Option

Next, you’ll want to configure the default email subject and body text, and whether users can edit those elements before sending the email. While still on the Features tab, scroll to the top of the screen and click on the Layout tab. Then, scroll to the bottom to see the new fields.

Email Builder

If you want to change the default text for certain groups or restrict who can edit the subject and body text, these options can also be overridden by the Frontend Group Override settings. To override one or more of these settings, navigate to Backend > Settings > Frontend Group Overrides > New Group Override > Layout tab.

To use the new email functionality, build a report as usual on your portal’s frontend by clicking on the Export as presentation icon. Once you add the first slide, you’ll see the old options to export as a Microsoft PowerPoint presentation and export as a PDF. However, now you’ll also see the new option to email the presentation as a PDF.

Email presentation as PDF

When you click on the envelope, you’ll be presented with a form to enter the email addresses of the desired recipients and edit the subject and body of the email (if allowed).

Enter emails and body text

The post Portals for Tableau New Feature Spotlight: Report Builder Emailer appeared first on InterWorks.

InterWorks Blog Roundup – April 2018

$
0
0
InterWorks Blog Roundup - April 2018

In addition to beautiful flora, April brought with it a multitude of excellent posts on the InterWorks blog. Our authors kicked things off with some good April Fool’s fun, created a handful of interesting vizzes ranging from pinball to LA crime,  shared some invaluable Tableau tips and even hosted some notable podcasts, including one with the creators of Tableau Prep. Long story short, spring has already sprung with loads of great data content. Get up to speed below on all of our April posts and stay tuned for even more this month!

News & Events


April Fools


Portals for Tableau


Podcast Your Data!


Tableau Tips & Tricks


Tableau Vizzes


OuterWorks

(Other interesting blogs we are reading outside of IW)

The post InterWorks Blog Roundup – April 2018 appeared first on InterWorks.

Ready for Alteryx Inspire 2018? So Is InterWorks.

$
0
0

Alteryx Inspire 2018 is only a few weeks away, and we can’t wait for another landmark event filled with knowledge, networking and all things analytics. Set in sunny Anaheim, California, on June 4-7, we might even soak up a few rays while we’re at it. But seriously, as an Inspire Gold Sponsor, we have a few things in store to make the conference an even better experience. Before we dive into what we’re bringing (like plenty of swimsuits), here’s a little background on what Alteryx Inspire entails and why you should go.

What Is Alteryx Inspire? Why Should You Attend?

For those unfamiliar with Alteryx Inspire, this is the largest annual gathering of Alteryx users under one roof. If you’re an Alteryx user, this is an excellent opportunity to connect with like-minded peers, sharing successes, challenges and tricks of the trade.

Alteryx Inspire also features several Alteryx experts in attendance, also known as Alteryx ACEs, whose mission is to help the community get the most out of the tool. In fact, InterWorks’ own Alteryx ACE, Michael Treadwell, will be at the conference ready to chat.

Finally, Alteryx Inspire is when Alteryx announces a host of new features as well as their vision for the upcoming year. If you’re curious to see what’s next in the world of analytics, this is the place to be – and we know how much data people like spotting a good trend!

What We’re Bringing

As part of our Alterx Inspire sponsorship, we’ll be setting up an InterWorks booth where you can come chat about Alteryx and really anything data-related. We have a few giveaways planned, so you’ll definitely want to stop by and say hello at the very least.

InterWorks at Alteryx Inspire 2017

Above: The InterWorks booth at last year’s Alteryx Inspire.

In addition to our team manning the booth, we’ll have several of our own Alteryx experts in attendance. We already mentioned Alteryx Ace Michael Treadwell, who will host a session entitled “First You Get the Alteryx Gallery API, Then You Get the Integrations” and participate in a panel discussion with other ACEs entitled “Alteryx ACE Fireside Chat.” Those sessions are at 2 p.m. on Tuesday and Wednesday of conference week. You can check out the full agenda in more detail.

InterWorks’ expert team of Alteryx trainers are also set to lead training courses during the conference! One of the great things about Alteryx Inspire is that it doubles as a training opportunity for those looking to improve their skills. Odds are that you’ll end up in one of their classes. If so, you’re in for a treat!

See You There!

That’s just a small glimpse of what you can expect from Alteryx inspire, but there’s so much more cover. Though Alteryx Inspire fast approaching, you can still register for the event. If you’re already signed up, all you have to do is show up! We can’t wait to see you there and hope you have a great time.

The post Ready for Alteryx Inspire 2018? So Is InterWorks. appeared first on InterWorks.

Portals for Tableau 101: Tableau Server Configuration

$
0
0
Portals for Tableau - Tableau Server Settings

Are you interested in embedded analytics but worried about where to start? Do you love the look of our Portals for Tableau but have little to no experience in programming? Welcome to “Portals for Tableau 101” where I will help guide you through Portals for Tableau with some introductory lessons. Today let’s start at the beginning and get your Tableau Server connected to the portal.

Accessing the Portal Backend

First, we need to log in to the backend of the portal. This backend login account is separate from your Tableau Server account and will be provided when you get a portal. To get to the backend landing page, type in the site’s backend URL, e.g. https://[site-url]/backend.

Portals for Tableau Backend

From here we click on the Settings button in the top navigation. Once you’re on the Settings page, click on the Tableau Server Settings menu link in the left-hand navigation:

Portals for Tableau - Tableau Server Settings

Connecting to Your Tableau Server

When you see the landing page for Tableau Server Settings click on the Connectivity tab. On the Connectivity tab, you will need to enter the Tableau Server URL you want to which you want to connect. You’ll also need to select the Server Version:

General Tableau Server Information

We always suggest you connect to the Tableau Server REST API to use the full functionality of the portal. To do this, you will need a Tableau Server Admin or Site Admin account. The reason we need these higher-permission accounts is that the backend systems needs permission to request the information from the Tableau Server. What a frontend user will see is based on their Tableau Server account and not the backend Service Account.

Specify Site and Authenticate

The Tableau Server Site drop-down will display a list of Tableau sites you can select to authenticate against. The drop-down will only display a list if your Service Account is a Tableau Server Admin and the settings have been saved.

Tableau Server Site (Custom) is used when you are not using a Tableau Server Admin account. If you are using a Tableau Site Admin account, then you must specify what site that admin belongs to. The value is derived from the URL on Tableau Server, e.g. PortalDemo on our site.

Trusted Ticket Authentication can be enabled as well. To do this, check the box and follow the instructions that display in the new popup. This should be some useful information you will need to send to the admin of your Tableau Server. If you have problems with trusted tickets, try our debugging steps.

That’s all you need to know to have your Tableau portal talk to your Tableau Server. We do have more advanced options for unique setups, but we will cover those at another time. For now, you can go out there and start adding dashboards to your new portal!

The post Portals for Tableau 101: Tableau Server Configuration appeared first on InterWorks.

How I Went from Management Consultant and Trying to a Start a Restaurant to InterWorks Analytics Consultant

$
0
0
The places I travel at InterWorks

I was born in New York City to two Chinese parents who emigrated from Hong Kong when they were kids. We bounced around different boroughs before my parents decided to set up in what I like to call, Good Ol’ Dirty Jerz (that’s New Jersey). This is where they popped out my little brother, Terrance.

My brother Terrance and I

Above: Back in 2008, we stored our love in our cheeks.

Since I was in eighth grade, I realized I had a strong interest in the sciences and wanted to pursue a career in medicine, which my parents fully supported. It was a great way to combine science and the ability to care for people in a way that no one else could. For high school, I went to Academies at Englewood, which had five separate academies that students could choose from to focus part of their studies. I chose the Biomedicine Academy. Fast forward four years of high school drama (not drama classes) and another four years getting my B.S. in biology at George Washington University, and I started working as a healthcare consultant for Booz Allen Hamilton in Washington, D.C.

My family at my college graduation

Above: Shout-out to the family for their love and support getting me through college. 😊

Medicine, Management, Cooking, Consulting

I still had the intention of going to medical school, so I took my MCAT my first year out of school in January 2015. After that, I dabbled with some of my other interests like cooking. This led me to partner with a friend for a food entrepreneur competition in which we planned to start our own restaurant. We ended up placing in the top five out of 50 and began pitching our idea to a panel of investors who would ultimately decide the winner of the competition.

We didn’t win, but I ran some pop-ups in D.C. to try gaining more traction while balancing my full-time job at Booz Allen. Realizing that I could not balance both, and I wasn’t in a financial position to drop my full-time work, I ended up dropping the restaurant idea. A year into my job, I started to realize that I wasn’t a cultural fit with the company and it really hindered my motivation. I had also dropped my pursuit of medical school, realizing there was more to myself that I had to discover.

A pop up in D.C.

Above: One of my pop-ups back in the day.

I told myself I was going to change. I needed something that was going to give me the freedom to express myself and the work would have to align with my personality. I was always worrying about the future and trying to plan what to do next. This led me into thinking more along strategic consulting. However, a large foundation for strategy was data analytics. Coming from a scientific, non-technical background, I signed up for some online classes to learn SQL and Python to better position myself for these types of jobs.

Now that I had an idea of what my next job was going to be, I needed to figure out the right culture fit for me. It was the first priority I was looking for in a company as it would help me grow as both a professional and individual. In terms of what I was looking for, it was the opposite of everything I currently had. That’s when I came across InterWorks on LinkedIn.

Taking a Chance on InterWorks

I had not heard about InterWorks until arriving at their LinkedIn page. Upon further research on Glassdoor, I saw there was a very high employee satisfaction – something I really valued in a company. It’s ability to appreciate their employees. They were also big on data, a side of myself I was starting to feed more and more. Running off feelings of “let’s give it a shot,” I applied and got an email for the first-round interview.

I approached this with a fairly open mind, not expecting to stick with the entire process. I got to the stage where I had to create a dashboard. With zero experience in Tableau, I tried to learn everything I could through the InterWorks blog. Five rounds and three months later, I found myself sitting in a rental car in the parking lot outside of InterWorks HQ in Stillwater, Oklahoma, thinking “how did I end up here?” Some of my friends were like “what kind of company makes you go through this?” My parents thought it was kind of crazy!

The truth is, how many companies are willing to invest the time, energy and resources to really make sure that the person they hire is the right person? To coordinate potentially 10+ employees to interview one candidate and possibly still say no at the end of all is a serious commitment. I wanted to be surrounded by people who always approached their work and hobbies in their life with passion and energy, and I knew that going through this thorough interview process was to prove if I was that person.

If any of you have read InterWorks CEO Behfar Jahanshahi’s “Hell Yes” post on this, you’ll understand why the process is what it is. It’s about more than whether a person can do the job. I interpret it as the person they want is going to bring the passion and energy to go beyond what the job description says. Are they someone I can count on when I need it? Are they someone I simply would want to grab a drink with? I can say there isn’t one person in company with whom I wouldn’t want to grab a drink.

Two days after my interview with Behfar, I got an email with an offer letter. I was in a meeting with co-workers and tried to hide my excitement. Pretty sure you know what my answer was.

My outfit at my first InterWorks Holiday Party

Above: Making first (and lasting) impressions at my first InterWorks Holiday Party.

Life as a Road Warrior

Having been at InterWorks for only eight months, it’s actually insane to think of all the things I have done since I started back in September. I’ve traveled to New York, Boston, Chicago, San Francisco, Los Angeles, Atlanta, Knoxville, Richmond and back to my home city, Washington, D.C., to teach clients the capabilities of Tableau (hotel and airline points FTW).

I tell students and clients that I like to run my classes like a restaurant. I am the chef, waiter and host, and I’m looking to tailor the material to how they learn. Just like everyone has different taste in food, we have to appreciate the different ways in which people learn. I meet so many people of different ages, backgrounds and interests. What is interesting, and something I did not expect, is that as much as they learn from me about Tableau, I also learn about how different industries work.

The best is when I get to meet up with some of the other InterWorks fam in an area for work or in their home city. They are extremely welcoming and always ready to throw down for a good time to enjoy the unique foods and sights the city has to offer. I also get to fly back to visit my family back in New Jersey more often and share my road warrior stories with them. I may spend a great deal of my time on the road and working with Tableau, but my passion for food, cooking and sharing conversation with people hasn’t gone anywhere. It’s been intertwined with my work to the point where work doesn’t just feel like work; it’s an adventure.

The places I travel at InterWorks

Above: Just a few of the good times from the past eight months at InterWorks.

The post How I Went from Management Consultant and Trying to a Start a Restaurant to InterWorks Analytics Consultant appeared first on InterWorks.

The Tableau Performance Optimization Flowchart

$
0
0

Everyone looking at a dashboard expects it to load and respond quickly. What defines “fast” varies from one person to another. As we discussed recently on our Tableau Performance episode of “Podcast Your Data!,” something that takes minutes to load could still feel fast compared to the effort it took before automating things in Tableau. No matter the benchmark, we want things to be quicker. Now, we have a performance troubleshooting guide to navigate you through the steps to improve Tableau dashboard load times.

Download the Flowchart

Narrowing Down Tableau Performance Issues

We start with a simple, common question: “Why is my Tableau dashboard slow?” If we know what’s causing the slowdown, we then ask: “What can I do to fix it?” The answers fall into a few basic categories:

  • Strain on Tableau Server resources
  • Database responsiveness (including Tableau extracts)
  • Amount of data to render
  • Updating UI elements like drop-down filters
  • Calculation efficiency

 
The Tableau Performance Checklist covers these areas, explains likely problems and offers solutions to each. But, not every part of that checklist will apply to your situation. What you need is a step-by-step guide to help you narrow down the possibilities, ignoring the things that don’t apply and focusing on the ones that do.

The first few steps in the flowchart help you determine if there’s a problem with the server or the underlying data architecture. From there, it helps you find issues with dashboard design, calculations and other common problems.

You can download the full PDF version of the chart, including hyperlinks to additional resources, at the bottom of this post. Here’s a quick glimpse of page one:

Tableau Performance Optimization Flow Chart - Page 1

Don’t Forget: Load Time Isn’t Everything

I always stress to people that “slow” isn’t limited to load times. As you’re evaluating performance, don’t forget to ask yourself and your audience these questions:

  • How long do people have to wait for dashboard design changes?
  • How much time does it take a user to understand the data presented?
  • Does it take several clicks (and wait between each click) to get the desired view?

 
Even if your dashboard loads in less than five seconds, you may not have solved the most important performance problems. If it takes days or weeks to change things, is difficult to use or makes the data hard to understand, then focus on solving those problems first. People will give you grace for a few extra seconds to load something if it saves them time and frustration in other important ways.

Further Reading

Anyone who designs Tableau dashboards should read Tableau’s “Designing Efficient Workbooks” whitepaper. It’s lengthy, but more than worth the time invested. The PDF version of the Tableau Performance Troubleshooting Flow Chart links to several things in the Tableau Performance Checklist, but it can’t cover every scenario. Read through the checklist and dive into the related posts for more solutions.

Download the Flowchart

That’s it! Download the full PDF version of the Tableau Performance Optimization Flowchart by filling out the form below, and don’t hesitate to reach out if you have any Tableau performance questions.

  • This field is for validation purposes and should be left unchanged.

The post The Tableau Performance Optimization Flowchart appeared first on InterWorks.


Portals for Tableau New Feature Spotlight: Navigation Site Switcher

$
0
0
Portals for Tableau Only Dashboards on Selected Site

Portals for Tableau make it easy to show all of the relevant dashboards across your Tableau Server regardless of which site they may be in. However, if you really need to just see the dashboards in a certain Tableau Site, it can make it difficult to find in the navigation. Perhaps it has nothing to do with how big your navigation menu is. Maybe you just want to play favorites and only show one lucky site. Whatever your reasons, the site switcher feature is just for this purpose.

To enable this feature, navigate to Backend > Settings > Portal Settings > Features, toggle on the Site Switcher option and save:

Portals for Tableau Site Switcher

On the frontend, you’ll now see a menu to filter your navigation menu to just dashboards in a certain Tableau Server site:

Portals for Tableau Filter Navigation

Once you select a site in the list, you’ll see the navigation filter itself to only the dashboards in the selected site:

Portals for Tableau Only Dashboards on Selected Site

If you would like to exclude certain groups from using the site switcher, it has also been added as an option in the Frontend Group Overrides settings. You could also enable it for certain groups instead if you want:

Portals for Tableau Frontend Group Overrides

The post Portals for Tableau New Feature Spotlight: Navigation Site Switcher appeared first on InterWorks.

Tableau Prep: How to Union and Join Your Data to Infinity and Beyond

$
0
0

As you may recall from my previous post, the year is 3015. As the spaceship sales manager for Toyota, I’m gathering data from the marketplace to analyze it, identify trends and eventually make pricing decisions based on my findings. We’ve been struggling to keep up with other manufacturers as of late, and it’s time to reverse the trend. They just don’t make spaceships like they used to.

I’ve been able to scrounge up planetary sales data from four different sources; Earth, Mars, Earth’s Moon, Io and data from the Andromeda galaxy. While my sales data is coming from different parts of the galaxy, it’s in a standardized format. Additionally, I have some data that lives in SQL Server containing customer information and demographics as well as various spaceship specifications.

Using Tableau Prep, I’ll show you how to combine all these disparate data sources into something easily digested by Tableau Desktop. If you need a refresher on joining data, Zac Heacker wrote a great blog on Combining Data with Joins. Let’s begin!

State of the Union

I’m going to start by opening Tableau Prep and connecting to my .xlsx sales files. For my analysis, I don’t want these datasets to be separated; since these four sources are identical in number of fields, field names and data types, I can union them into one set of data. Far out!

Here are my four standardized sales files waiting in the Flow Pane – all of them have TransactionID, CustomerID, ShipCode, SalePrice and SaleDate:

Tableau Prep - Standardized Files in Flow

To create the union, I’ll simply click on the + sign next to one of my data sources and select Add Union. You can see data profiling is available on the Union step, which is tremendously helpful:

Tableau Prep - Add Union

To add the other data sources to the new union, drag them onto the Union step and drop them on the +Add as shown here:

Tableau Prep - Add to Union

Once I’ve added all four data sets to the union, the Profile Pane shows what I’ve included:

Tableau Prep - Union Complete

Victory! I have now successfully combined the four standardized sales files into one set of data and any new connections to this Union step will treat it as such. Next, I need to join this unioned data to the SQL tables containing customer information and spaceship specifications.

… I know Join-Fu

Tableau Prep - Join Fu

After connecting to the SQL database, I’ll drop the customer_info and spaceship_mfg_info tables onto my Flow Pane. Notice the Custom SQL option here; you can craft custom SQL to retrieve data if necessary, but I just need these tables in their existing form:

Tableau Prep - Add Tables

I’ll be joining customer_info and spaceship_mfg_info to the Union data set sales_1 (just created) by way of their respective foreign keys (CustomerID and ShipCode). Do this by dragging and dropping from the Flow Pane onto the New Join side of sales_1:

Tableau Prep - Customer Info Join

Looking at the Join Panel in the Profile Pane, Tableau Prep smartly recognizes the join will be on Customer_ID. As expected, the data resulting from the join is now available for review in the Profile Pane, and the column headers are color-coded to match their source in the Flow Pane:

Tableau Prep - Customer Join Results

Since I’m just supplementing customer information to the sales data where it’s available, I’m going to adjust my inner join to a left join. Tableau Prep continues to be fantastically helpful with the visual aids and data profiling, even on something as seemingly mundane as applying a join.

Now, I want to join spaceship_mfg_info to this freshly joined sales and customer data. To accomplish this, I’ll drop spaceship_mfg_info onto the Join step I just made as another New Join:

Tableau Prep - Ship Join

Once again, Tableau Prep identifies the correct key field to join on (ShipCode). The Profile Pane shows me there were 15 ShipCodes that were not involved in any sales, and therefore will be excluded from the Join Results. I can even click on the Excluded values to see them profiled, showing exactly which ships were not found:

Tableau Prep - Ships Not Found

Bonus time: Doing a cursory review of my final set of combined data, I noticed the SalePrice and SaleDate columns must have been set to text in the Excel files (so much for standardized format!). I want to change these into decimal and date respectively, so I can use them more efficiently in Tableau Desktop. Both will be easy fixes in Tableau Prep and will require no backtracking because I can simply transform the fields from the “final” Join step itself!

For SaleDate, I’ll just click on the data type indicator within the Profile Pane, select date and “viola!” – a Clean step is added with the appropriate transformation:

Tableau Prep - Ship Date

To fix SalePrice, I’ll try an Automatic Split – to my delight, the $ symbol has been stripped out and my newly created value is in decimal format. Then, I’ll just delete the “bad” field and rename the split value accordingly. Now we’re cooking with lasers!

Tableau Prep - Sale Price

I have now successfully combined my four .xlsx sales files with the two SQL tables containing customer information and spaceship specifications! Adding an output step at the end, here’s the current state of my Flow. From here, I can create a Tableau Data Extract, .csv output file or even publish a data source to Tableau Server:

Tableau Prep - Final Flow

That’s all for now! Stay tuned for more Tableau Prep fun, and please reach out to us today if you have any questions or want to learn more about how InterWorks can help you master your data.

The post Tableau Prep: How to Union and Join Your Data to Infinity and Beyond appeared first on InterWorks.

Portals for Tableau 101: Dashboard Creation

$
0
0

Welcome back to Portals for Tableau 101! In today’s lesson, we will cover how to add a dashboard to your portal from Tableau Server. If you missed the last lesson, please check it out as we cover how to set up your portal to connect to your Tableau Server. If you’ve stumbled upon this post and aren’t sure what a portal is, head to our Portals for Tableau solution page.

Adding Dashboards to Your Portal

Now that we have the portal configured to work with the Tableau Server, we can begin to add dashboards to the Portal. To start we will have to log in to the backend of the portal: https://[site-url]/backend. After logging in, click on the Content button in the top navigation.

Portals for Tableau - Content Button

Next, we will click on the Dashboard button in the left-hand navigation. This will take is to the dashboard landing page. Here we can click the New Dashboard button to create a new dashboard.

Portals for Tableau - Dashboard Button

On the dashboard create/edit page you will see the Site, Workbook and eventually the View drop-down.

Portals for Tableau - View Drop-down

The Site drop-down will be automatically chosen based on the Tableau Server Site in the Tableau Server Settings. If you set up the backend Service Account with a Tableau Server Admin account, the Site drop-down will let you select from the different Tableau Server sites to pull workbooks from. This can also be done with a Tableau Site Admin account if the account is also a Tableau Site Admin for other sites.

Selecting Your Dashboard, Filling Out Fields

Once you select the site to work with the system will pull in all the workbooks from the site. Then you can select the desired workbook to populate the View drop-down. Select the view you want to add to the portal and the system will automatically fill out the required fields.

Portals for Tableau Dashboard Setup

The Title field will be filled out using the View/Dashboards Title on the Tableau Server. You can change this field to be anything you want it to be if you’re not happy with the default title.

The Tableau Server Dashboard URL’s format will look like the URL from the Tableau Server. It will be changed to work with the APIs and you will not need to edit it.

The final field to be automatically completed will be the Portal Dashboard URL “Slug.” This will affect the way the URL looks on the Portal. The system creates this based on the Workbook and View name so many people like to change it to be more concise.

If you have published your workbook sheets as tabs, you can display these by flipping the Show Tabs switch. This will publish the tabs in a web-friendly format instead of the default Tableau Server version.

Create Menu Link will add a dashboard link to the main menu when checked. It will be automatically added to the bottom of the list of the main menu. You can rearrange this in the Navigation menu section.

More/Advanced Options

We have more options that greatly expand the functionality of our dashboard located in the Misc and Advanced tabs. For more on these features and others, please check out our documentation page.

The post Portals for Tableau 101: Dashboard Creation appeared first on InterWorks.

InterWorks Named Silver-Level Bicycle Friendly Business for 2018

$
0
0

In honor of National Bike to Work Day (and week), we have a special announcement: InterWorks was recently named a Silver-Level Bicycle Friendly Business by the League of American Bicyclists! We’ve earned this distinction in previous years, but we’re excited to keep the tradition going for 2018.

What Does Being a Bicycle Friendly Business Mean?

The Bicycle Friendly Business program seeks to recognize businesses that are dedicated to strong bicycle culture. To do this, businesses fill out an extensive survey, answering questions on how they promote biking internally, what facilities they have to support cyclists and how they advocate biking initiatives in their communities. Businesses that go above and beyond and all categories are recognized as “bicycle friendly” and earn varying distinctions depending on the level of their commitment.

Bicycle Culture at InterWorks

What exactly makes InterWorks worthy of Bicycle Friendly Business honors? Well, we’ve been promoting biking for a few years now. What started out as a hobby between a few employees has since grown into a larger, company-backed culture.

InterWorks has always supported to passions of its employees, so as the bicycle bug bit more of our people, we started looking at how we could use cycling as a means of bringing people even closer together. More people biking to work prompted us to put in bike racks in our three primary Oklahoma offices as well as tools for people to work on their bikes. A casual dress code and places to change also makes it easy for people bike to work without hassle.

InterWorks Bike Racks

Above: Bike racks at InterWorks HQ in Stillwater.

Perhaps the biggest investment we’ve made is our participation in events like OK Freewheel. We spent the past three years rallying any cyclist who wants to take on the week-long trek across Oklahoma and have covered all registration expenses. We even offer a PTO match for those going on the ride. It’s also a great excuse to bring out the InterWorks-branded tailgate trailer as our ultimate support vehicle.

Beyond facilities and events, we sponsor all the local biking initiatives we can. InterWorks CMO Dalton Parsons and Regional IT Practice Lead Scott Matlock are both members of the Stillwater Trail Crew, and we’re proud to sponsor their development of area trail systems. Will Joyce, our General Counsel and Mayor of Stillwater, is also an avid cyclist who supports bicycle initiatives in city government. The list goes on and on, even including our CEO, Behfar Jahanshahi.

InterWorks at OK Freewheel 2017

Above: The InterWorks crew at OK Freewheel 2017.

It’s Bigger than Bikes

Our commitment to bicycle culture goes well beyond an intrinsic love for bikes. As we said before, InterWorks’ M-O is to back our employees and their passions. A passion like cycling is an easy one to get behind, given the health and environmental benefits it provides. But whether it’s bikes or bullfighting, the bottom line is that we’re all in when it comes to our employees. Their interests are our interests, so we’re happy to give them the resources they need to enjoy themselves to the fullest. After all, happy employees are the best kind you can have.

The post InterWorks Named Silver-Level Bicycle Friendly Business for 2018 appeared first on InterWorks.

PYD57 – Big Data, Small Data, No Data & Lego

$
0
0

Story Time with Lego!

Today’s episode delves into the problem with averages and how one can gain interesting insight by deconstructing the outer layers – something that kids are notoriously good at by asking the 5 Why’s (though we’re pretty sure they don’t mean it in the same way). We also jump into several books and have our first book review.

Algorithms to Live By by Brian Christian & Tom Griffiths

Here are the other books we talk about:

Ask by Ryan Levesquehttps://www.amazon.com/Ask-Ryan-Levesque/dp/1939447720

Deep Work by Cal Newport – https://www.amazon.com/Deep-Work-Focused-Success-Distracted/dp/1455586692

Subscribe to Podcast Your Data through iTunesStitcherPocket Casts or your favorite podcasting app.

The post PYD57 – Big Data, Small Data, No Data & Lego appeared first on InterWorks.

Viewing all 2695 articles
Browse latest View live