![New Columns]()
Recently, I was required to prepare data in Alteryx and output it into a .Hyper file to create a Tableau workbook. The data that was being utilised looked at past sales and potential future sales. The dataset was a very large dataset, over 20 million rows long and 100 columns wide.
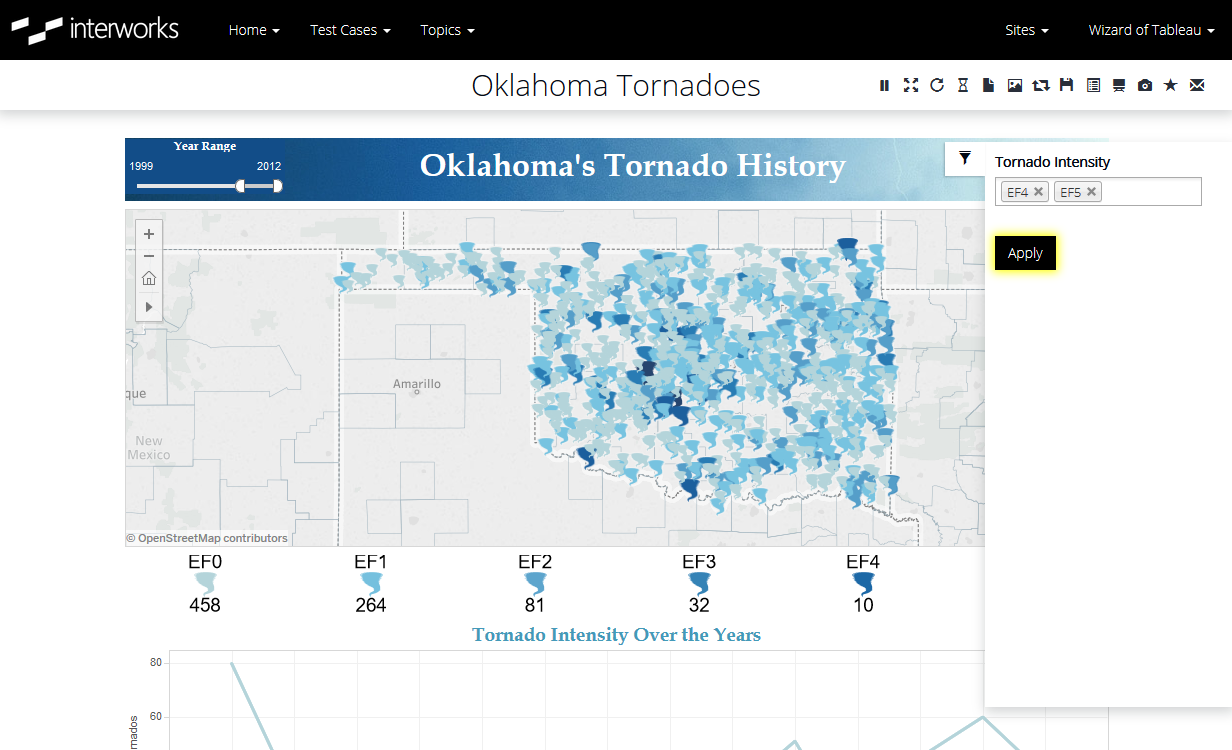
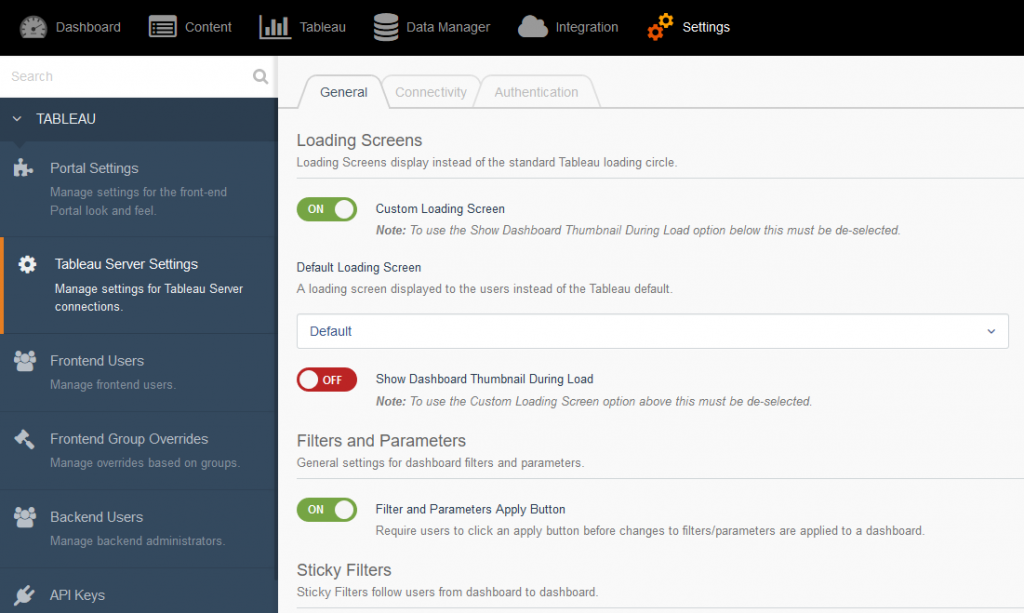
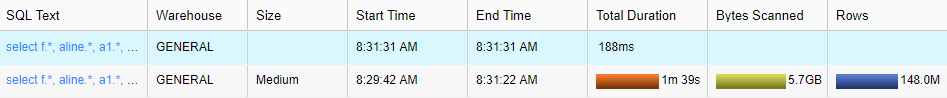
Once the workbook was built in Tableau and published on the customer’s Server, the performance of the workbook was below what was expected of the client. Consequently, there were some performance optimisation techniques required to amend this. It was this process that gave me the idea to write this blog post. One of the main optimisation strategies that could be implemented would be to aggregate the data. In this situation, we were unable to do so as the end user wanted to be able to investigate each individual opportunity or sale.
This post concentrates on increasing the performance of a Tableau workbook by passing calculations built in Tableau into Alteryx. This positively impacts the performance of the workbook, instead of Tableau having to process a logic statement, such as an IF or CASE statement. Tableau will only have to deal with a predefined number, as Alteryx has completed the heavy lifting by calculating the logic statement.
The most important question here is: “What calculations are relevant for your analyses?” Choose the filter calculations that are required for your reports. If not all are covered in this post, the ones that have should act as a stepping stone to creating the remaining calculations.
Breaking Down the Process
This process will be broken into two blog posts. The first blog will be based on creating the foundation Filter Calculations. These are the core of the optimisation calculations. Much of the calculations in the latter stages will be based on these calculations. These will include Date, Date Parse and Boolean calculations. These will predetermine several timeframes. For example, Year to Date, Current Month, Previous Year, etc. Although not all these calculations will be relevant to the user, it is possible to pick and choose the ones needed.
The second blog post will be split into two segments building the single metric calculation and multi-field calculations. This section of the blog is for users who have large data sets and need to increase workbook performance. In these segments, the newly calculated Boolean filter calculations will return a variable value when the filter is “True.” This rationale will be applied to both segments of the second blog post.
Data
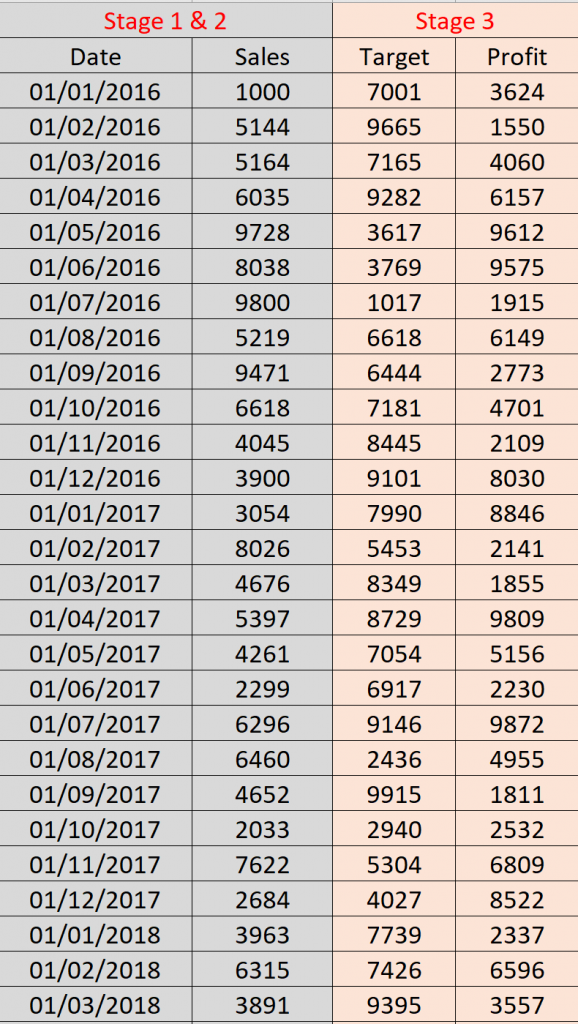
For simplicity reasons, a sample data set has been used. The data examines the monthly Sales, Target and Profit. Each row correlates to a month of data. The data is updated on the first day of the month. The data runs from January 2016 until December 2020.
This post has been written in August 2018. It will be taken that all the data up to August 2018 is actual data as the data updates daily, while everything after this is forecasted. This point of when your data will be updated will be talked about in more detail when it comes up in the workflow.
![Underlying Data]()
Download the data at the bottom of the post.
As mentioned earlier, this segment is laying the foundations for the rest of the workflow and dataset. What work is completed here allows the user to create the calculations in next blog post. The following filter types will be made.
| Name |
Alteryx Name |
|
Name |
Alteryx Name |
| Actual/Forecast |
Actual/Forecast |
Current Year Current Month |
Filter_Current Month |
| Current Year |
Filter_Current Year |
Previous Year Current Month |
Filter PY Current Month |
| Previous Year |
Filter_Previous Year |
Current Year to Date |
Filter_CYTD |
| Current Months |
Filter_Current Month Comparison |
Previous Year to Date |
Filter_PYTD |
| Year to Date |
Filter_YTD Comparison |
|
|
To create these, we will need to complete several steps involving the separation of Date as well as creating a date that signifies Today’s Date (or whenever the data is updated).
Step 1
Load the sample data into Alteryx and pull the Formula Tool into the workflow
Step 2
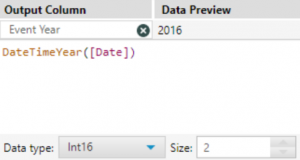
Create Event Year. This will pull the Year from the date field. Ensure that the Data Type is numeric. Use the calculation DateTimeYear ([Date]).
![Event Year Calculation]()
Step 3
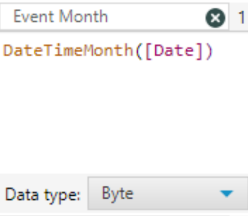
Create Event Month. This pulls the month number from the Date field. This will range from 1-12. Use the calculation DateTimeMonth([Date]), ensuring the Data Type is numeric.
![Event Month Calculation]()
Step 4
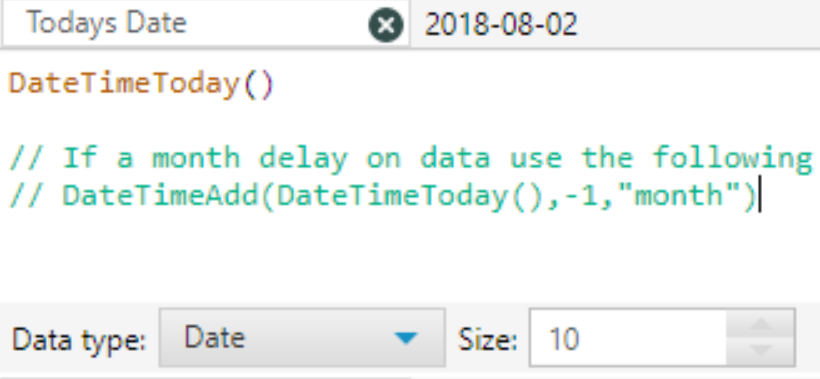
Create the Todays Date formulate. This will correlate to the day on which your dataset is updated. In this use case, we’ll take it that the dataset is updated until August 2018 (it’s currently August 2018). So, the formula that will be used is DateTimeToday().
![]()
However, in many companies, the data can lag by a certain amount of time. In this case, for example, it could be taken that the June 2018 numbers are only available during August 2018, as it takes a month for internal processes to get the July 2018 numbers ready for analysis. The DateTimeFormat calculation would be required as this allows the user to manipulate a part of the date. The calculation DateTimeToday() is manipulated,by deducting 1 (-1) from the month value. This means that the columns Todays Date will return 2018-07-18 rather than 2018-08-18, as seen in the earlier calculation. The full calculation is as follows:
DateTimeAdd(DateTimeToday(),-1,"month")
Step 5
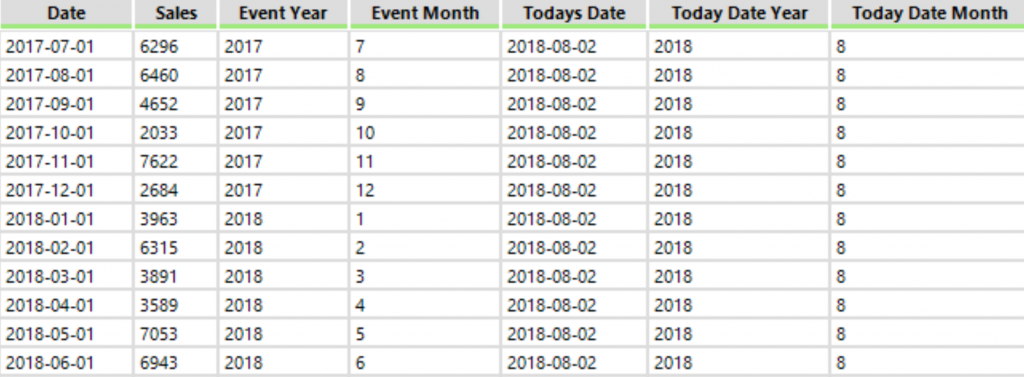
Repeat Step 2 and Step 3 for the new field Todays Date. By this step, the dataset has grown from two columns to seven columns. These columns are the foundation for making the filter calculations.
*Ensure that you are happy with the calculation names here. They should make sense going forward, as to make changes to the names later will mean that edits will be needed for all the calculations that hold these five calculations.
![New Columns]()
Now for the fun part! Creating the filters.
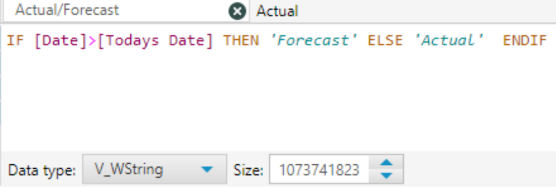
Step 6: Actual/Forecast
This is to differentiate between the actual and forecasted values. The way to do this is to see if the value [Date] is greater then [Todays Date]. If it is, then the value is forecasted. If not, then it is the actual value. This is the only “filter” that has a String data type, the rest of the data types will be Boolean.
![Actual/Forecast Calculation]()
You can see how important it is to know when the data is updated. In this case, we assume that the data is updated daily.
This calculation is an IF statement with the following syntax:
IF [Date]>[Todays Date] THEN 'Forecast' ELSE 'Actual' ENDIF
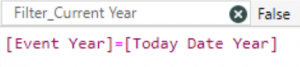
Step 7: Filter_Current Year
In the next number of steps, you will see why we parse out the two date fields. For this current year filter, a Boolean calculation will be needed, so ensure that the data type is changed to Boolean for the Filter calculations. This will return either a True or False. In this case, the True will be if the Event Year equals Todays Date Year, e.g. if “2018=2018.”
[Event Year]=[Today Date Year]
![Filter_Current Year]()
Step 8: Filter_Previous Year
This is very similar to Step 8. However, we are going to change the Today Date Year by reducing it by one year. Instead of being 2018, the value will be 2017. The calculation will look like the following:
[Event Year]=([Today Date Year]-1)
![Filter_Previous Year]()
If a filter is required for two years previous from today’s date, then replace -1 with -2.
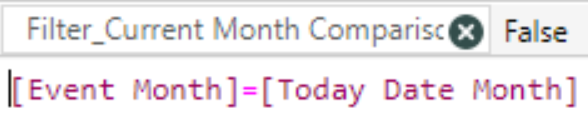
Step 10: Filter_Current Month Comparison
This is to return a value of True when the Event Month equals the Todays Date Month. In this case, when both values are equaled to 8 (August). Here, Year is not considered, so it will return True for all months equal to, regardless of what year it is. This is a good filter for comparing the current month to this time last year. The calculation for this is:
[Event Month]=[Today Date Month]
![Filter_Current Month Comparison]()
Step 11: Filter_YTD Comparison
The purpose of this calculation is to see what the sales have been up until the current month of the year. This is good for comparing performance between different years up until the same point. In this case, we will be looking at the fields Event Month and Todays Month. We will only want to return the Event Month values that are less than or equal to Todays Month. In this example, with Todays Month equaling 8, the calculation will need to return Event Months, where the values are 1-8. The calculation for this is:
[Event Month] <= [Today Date Month]
![Filter_YTD Comparison]()
Step 12: Filter_Current Month
This filter returns true for only the current month of the current year. It is built using two previously built filters Filter_Current Year (Step 7) and Filter_Current Month Comparison (Step 10). These are used together using an AND statement:
[Filter_Current Year] AND [Filter_Current Month Comparison]
![Filter_Current Month]()
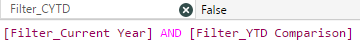
Step 13: Filter_CYTD
This calculation works off Filter_YTD Comparison (Step 11). It is combined with Filter_Current Year (Step 8). These are combined using an AND statement:
[Filter_Current Year] AND [Filter_YTD Comparison]
![Filter_CYTD]()
Step 14: Filter_PYTD
This calculation works off Filter_YTD Comparison (Step 11). It is combined with Filter_Previous Year(Step 9). These are combined using an AND statement:
[Filter_Previous Year] AND [Filter_YTD Comparison]
![Filter_PYTD]()
You can download the packaged Alteryx workflow below.
Stay Tuned for Part 2
The subsequent blog post will examine how to apply these filter calculations to the required values in the data set. It will look specifically at applying the above calculations to one single metric or to multiple metrics at once.
The post Building Filters in Alteryx for Tableau, Part 1 appeared first on InterWorks.


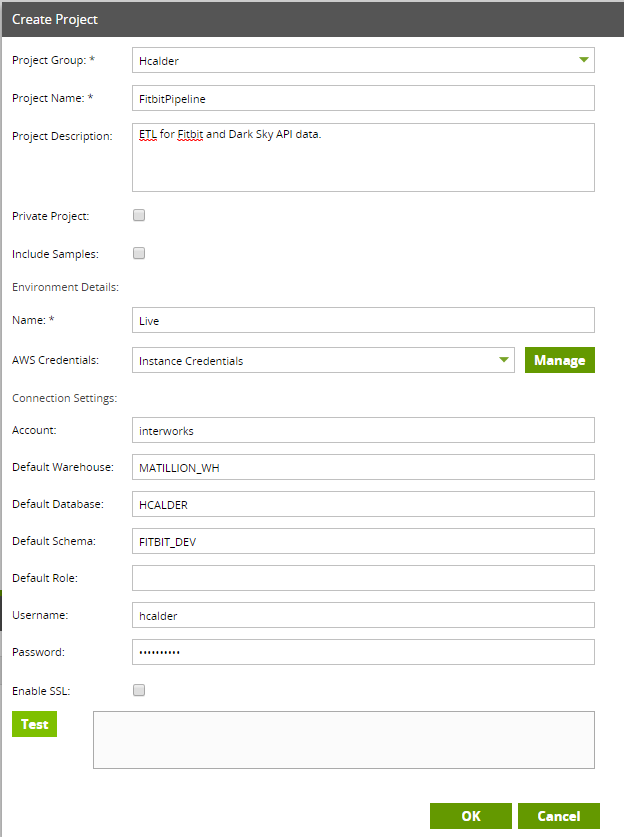
 ). From S3, I then want Matillion to take the Dark Sky JSON data and load it into a table, then do the same with the workout data. From there, I’m going to let Matillion to build a view with the tables that hold my data. Then, I will connect it to a Tableau dashboard for visualizations.