
Question: I want to allow my user to easily see a custom value that is connected to a highlighted point on my time series chart. How can I do this in a way that can also interact with a dashboard action to give these values more prominence and context for the user?
Client Scenario
You have a time-series chart that shows a metric over time, and you want your user to be able to select a custom point of interest (POI) and be able to show the value that is highlighted prominently. For example, imagine we want a user to be able to view sales for a given month in the past and have a separate scorecard dedicated to that POI. What we want can be seen below:
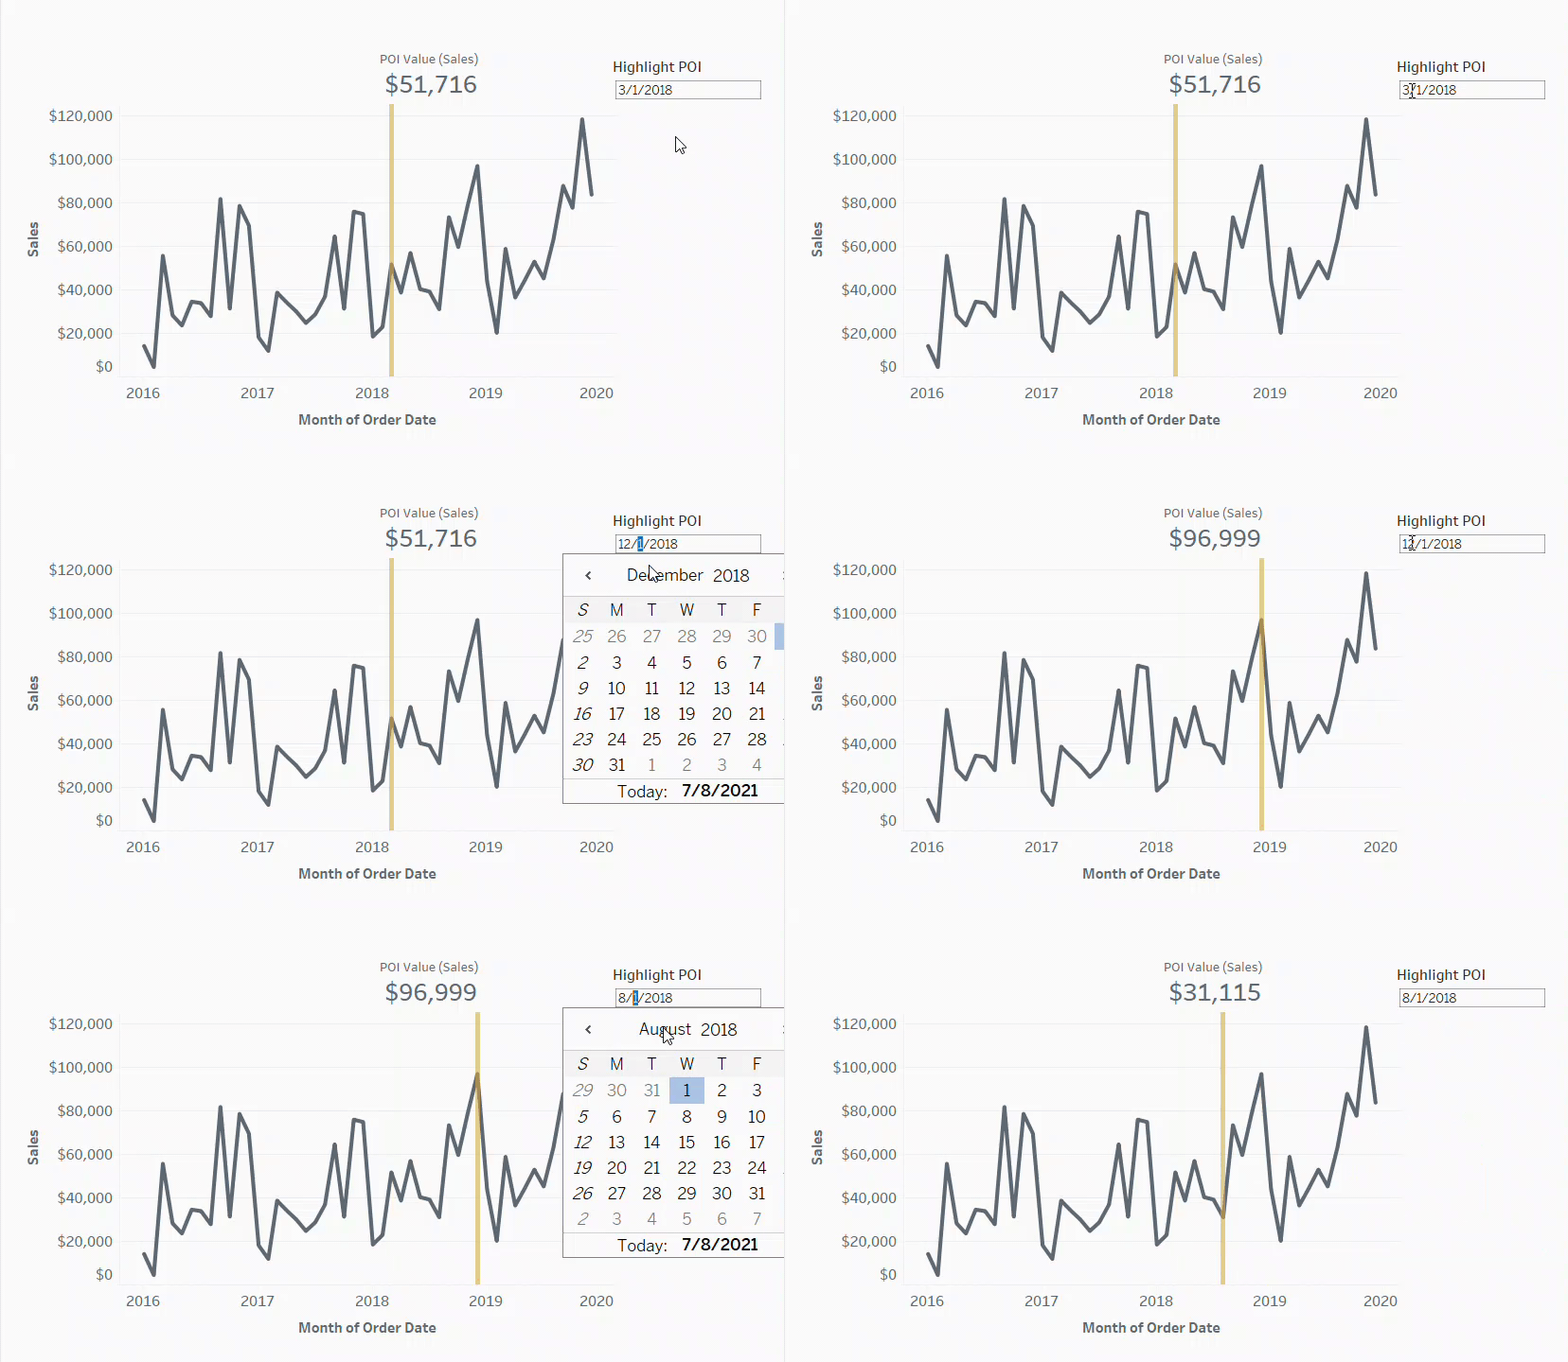
Here’s what we currently have:
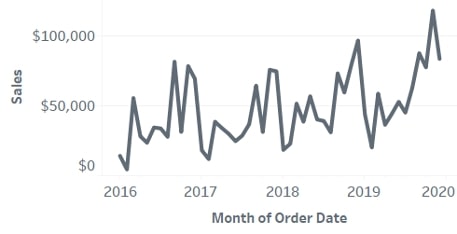
Here’s what we need:
- A parameter for the point of reference
- A highlight action for the reference line
- Three calculated fields
The Parameter
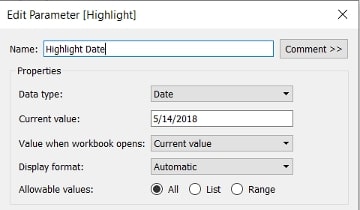
The highlight date is what will be placed on the chart and defined by the user as a point of interest:
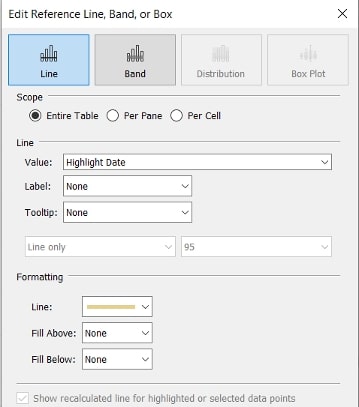
The Reference Line for Context
This reference line will use the Highlight Date parameter:
Calculated Fields in Tableau
Lookup Value: The number of periods (months) between your reference point and your current period, or the end of your dataset:

Lookup Highlight Point: The number of periods (months) between your reference point and your current period, or the end of your dataset:
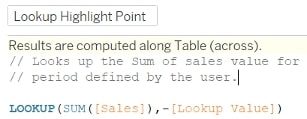
Show Value T|F: A Boolean field that will allow you to show the current lookup value on a separate sheet:

Set up the Context Scorecard
Here are the steps for setting up your scorecard:
- Create a new sheet
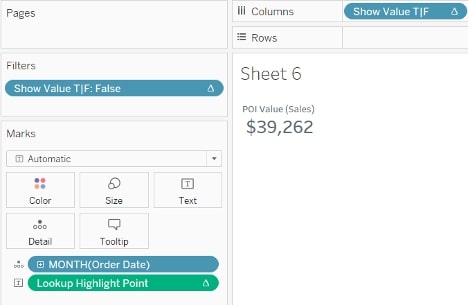
- Add Lookup Highlight Point to the Marks card as Text and compute using Cell
- Add your date field to Detail (MONTH, in this case)
- Add Show Value T|F to the Columns shelf and compute using Cell
- Filter Show Value T|F to show False only
- Uncheck Show Header on Show Value T|F
Voila! Your context scorecard is ready. Now, bring this onto your dashboard. With this approach, you could also do comparisons to other periods of interest or the current period:
I hope you find this helpful! If you need help like this, reach out and get InterWorks Assist on your team!
The post Advance with Assist: Highlighting Points of Interest appeared first on InterWorks.