Clik here to view.

For this tooltip, we have brought multiple worksheets together to give some additional information and improved formatting in our tooltip. The two bar charts are built as normal, and I’ve built two extra sheets for the vertical and horizontal lines in my tooltip:
Image may be NSFW.
Clik here to view.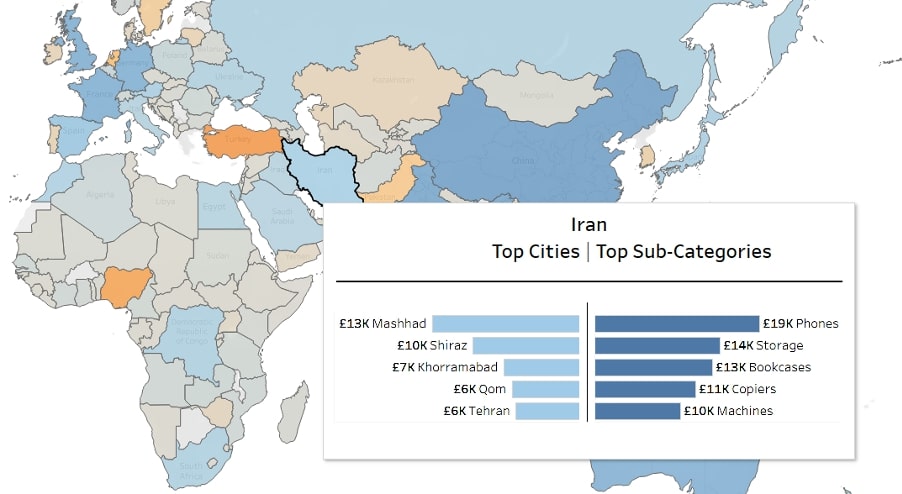
For the vertical separator, I’ve added a dummy calculation to Columns to create an axis, then increased the size of my zero line using the formatting options:
Image may be NSFW.
Clik here to view.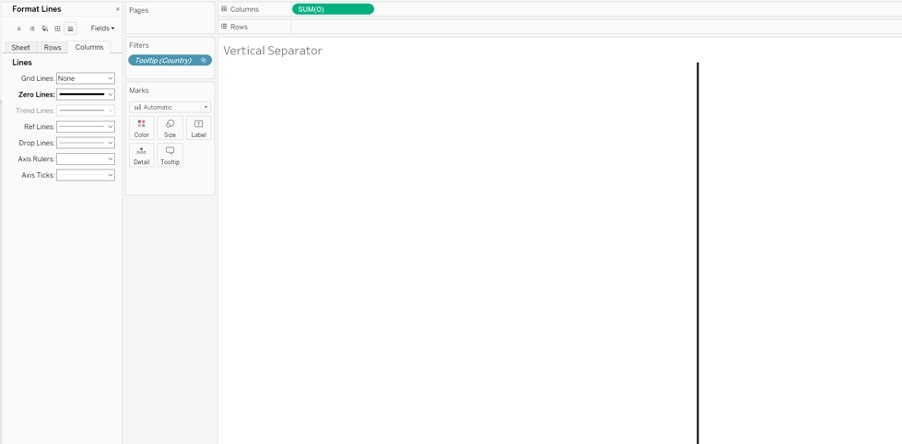
My Horizontal Separator is built the same way but with the formatting and calculation on Rows:
Image may be NSFW.
Clik here to view.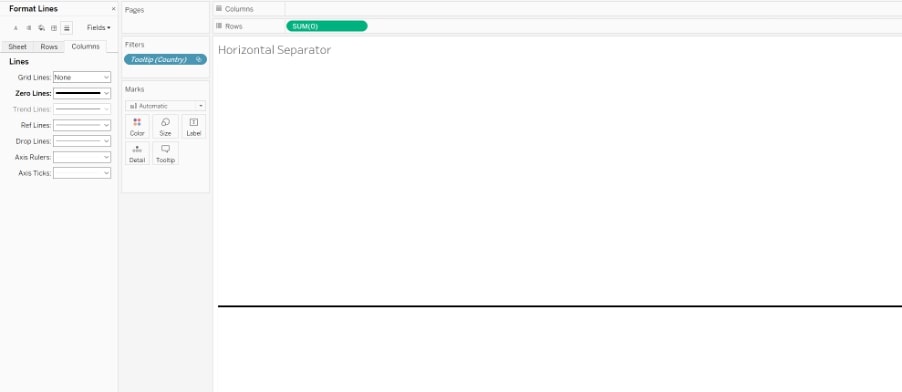
Now that I’ve got the four components of my tooltip, it’s time to start building.
Showing Multiple Vizzes with Tooltips
To make my two bar charts and the vertical separator show in line with each other, I need to add them all to my tooltip and remove any spaces between them. I also want my vertical separator to be very thin, so I’ve reduced the width to 10 pixels:
Image may be NSFW.
Clik here to view.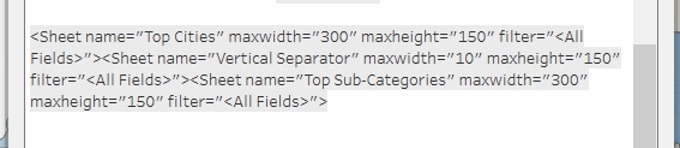
I know that between the three sheets, I have 610 pixels of total width. So when I add my Horizontal Separator in, it needs to be this width (and I can reduce the height):
Image may be NSFW.
Clik here to view.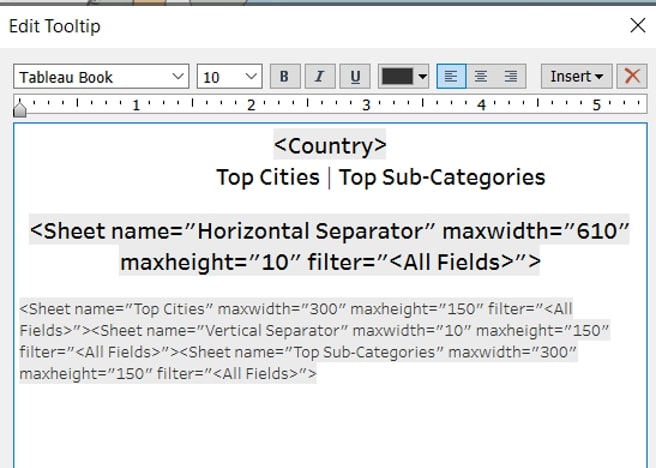
By using the dummy fields for separators, adjusting the height and width, and removing spaces to line up sheets horizontally, we can make multiple vizzes in tooltips look clean and polished.
The post Going Deep with Tableau Tooltips: Multiple Vizzes appeared first on InterWorks.
