According to Wikipedia, the Internet of things (IoT) is the network of devices, vehicles and home appliances that contain electronics, software, actuators and connectivity, which allows these things to connect, interact and exchange data. IoT involves extending Internet connectivity beyond standard devices, such as desktops, laptops, smartphones and tablets, to any range of traditionally dumb or non-internet-enabled physical devices and everyday objects. Embedded with technology, these devices can communicate and interact over the Internet, and they can be remotely monitored and controlled.
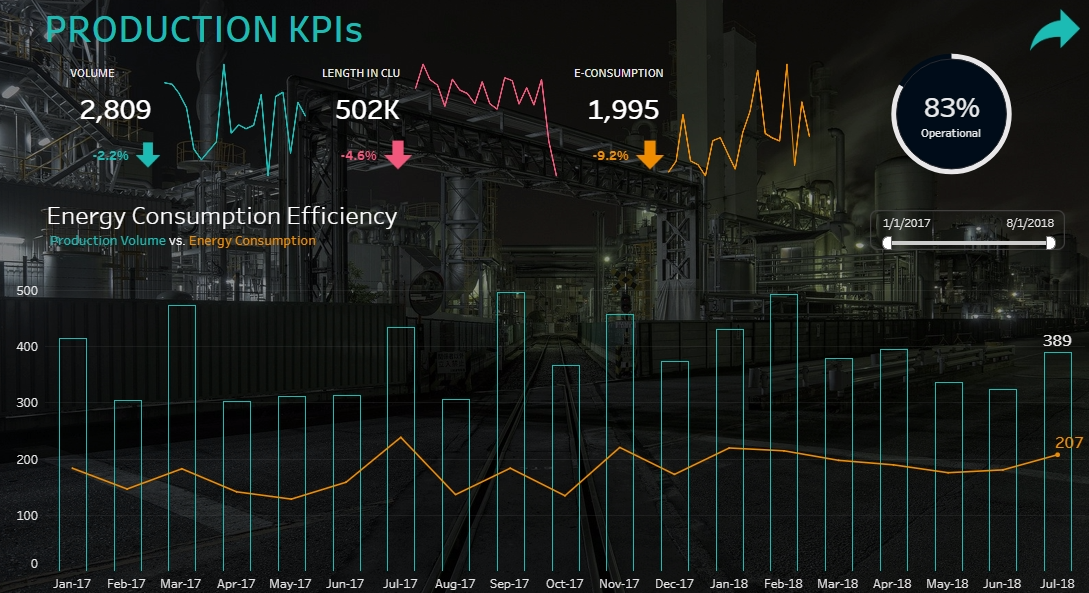
As an analyst, you could say that the more data we have access to, the better it is, but that’s not always the case. The arrival of IoT means that we can collect more data than ever before, but sometimes it is hard to know exactly what to do with it. The example below showcases the use of sensor data in a factory. Those sensors can report on energy consumption, output and general OEE (overall equipment effectiveness).
A lot of time was spent on deciding what to show and what to leave out. With so much data, it was important to focus only on what was relevant. Both dashboards are aimed at being shown on a screen in the factory floor for monitoring but especially the second one, which looks at data on an hourly basis.
I found it particularly pleasing to be able to use two new features from 2018.3: transparent sheets and buttons, which make navigation so much easier and cleaner. Those are two of my favourite new additions in the latest release.

The post The Internet of Things and Data Inundation appeared first on InterWorks.